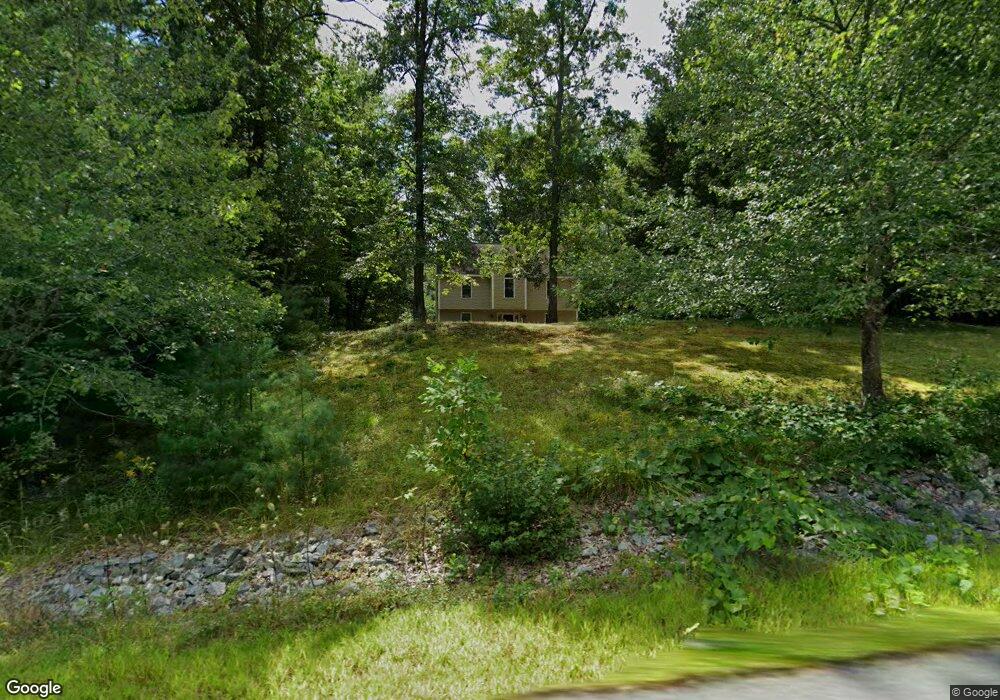
6 Lorden Ln Brookline, NH 03033
Estimated Value: $526,000 - $629,000
3
Beds
2
Baths
1,940
Sq Ft
$287/Sq Ft
Est. Value
About This Home
This home is located at 6 Lorden Ln, Brookline, NH 03033 and is currently estimated at $556,808, approximately $287 per square foot. 6 Lorden Ln is a home with nearby schools including Richard Maghakian Memorial School, Captain Samuel Douglass Academy, and Hollis-Brookline Middle School.
Ownership History
Date
Name
Owned For
Owner Type
Purchase Details
Closed on
Jun 23, 2000
Sold by
Hunter David J and Hunter Debra L
Bought by
Kohli Naveen K
Current Estimated Value
Home Financials for this Owner
Home Financials are based on the most recent Mortgage that was taken out on this home.
Original Mortgage
$174,800
Interest Rate
8.48%
Purchase Details
Closed on
Feb 28, 1997
Sold by
Mcmahon James L and Mcmahon Heidi A
Bought by
Hunter David J and Hunter Debra L
Create a Home Valuation Report for This Property
The Home Valuation Report is an in-depth analysis detailing your home's value as well as a comparison with similar homes in the area
Home Values in the Area
Average Home Value in this Area
Purchase History
| Date | Buyer | Sale Price | Title Company |
|---|---|---|---|
| Kohli Naveen K | $174,900 | -- | |
| Hunter David J | $131,000 | -- |
Source: Public Records
Mortgage History
| Date | Status | Borrower | Loan Amount |
|---|---|---|---|
| Open | Hunter David J | $25,000 | |
| Open | Hunter David J | $180,000 | |
| Closed | Hunter David J | $15,000 | |
| Closed | Hunter David J | $174,800 |
Source: Public Records
Tax History Compared to Growth
Tax History
| Year | Tax Paid | Tax Assessment Tax Assessment Total Assessment is a certain percentage of the fair market value that is determined by local assessors to be the total taxable value of land and additions on the property. | Land | Improvement |
|---|---|---|---|---|
| 2024 | $10,349 | $457,700 | $190,000 | $267,700 |
| 2023 | $9,511 | $457,700 | $190,000 | $267,700 |
| 2022 | $8,069 | $271,500 | $114,500 | $157,000 |
| 2021 | $7,759 | $271,500 | $114,500 | $157,000 |
| 2020 | $7,548 | $271,500 | $114,500 | $157,000 |
| 2019 | $7,772 | $260,200 | $114,500 | $145,700 |
| 2018 | $7,692 | $260,200 | $114,500 | $145,700 |
| 2017 | $7,125 | $216,300 | $92,600 | $123,700 |
| 2016 | $7,189 | $220,800 | $92,600 | $128,200 |
| 2015 | $6,856 | $220,800 | $92,600 | $128,200 |
| 2014 | $7,253 | $220,800 | $92,600 | $128,200 |
| 2013 | $6,984 | $220,800 | $92,600 | $128,200 |
Source: Public Records
Map
Nearby Homes
- 46 Oak Hill Rd
- 55 Oak Hill Rd
- 7 Winterberry Rd
- 6 Flint Meadow Dr
- 9 Winterberry Rd
- 6 High Oaks Path
- 22 Hobart Hill Rd
- 364 Townsend Hill Rd
- 15 N End Rd
- 167 Route 13
- 28A Rocky Pond Rd
- 21 Cranberry St
- 5 Carons Way
- 0 Brookline St
- 22 Austin Ln
- 64 Meadow Rd
- 93 Old Milford Rd
- 143 Worcester Rd
- 179 Brookline St
- 10 Boynton St