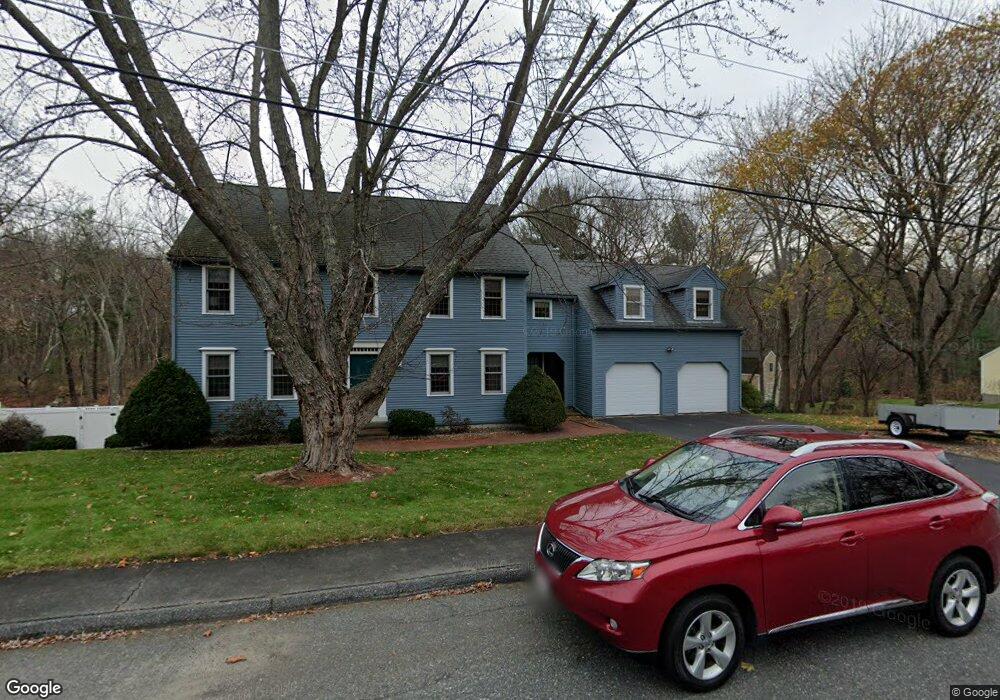
6 Lower Rd Hudson, MA 01749
Estimated Value: $798,989 - $988,000
4
Beds
3
Baths
2,773
Sq Ft
$314/Sq Ft
Est. Value
About This Home
This home is located at 6 Lower Rd, Hudson, MA 01749 and is currently estimated at $870,747, approximately $314 per square foot. 6 Lower Rd is a home located in Middlesex County with nearby schools including David J. Quinn Middle School, Hudson High School, and First Steps Children's Center.
Ownership History
Date
Name
Owned For
Owner Type
Purchase Details
Closed on
Aug 18, 2020
Sold by
6 Lower Road Nt
Bought by
Andrade Armindo and Andrade Laurie
Current Estimated Value
Home Financials for this Owner
Home Financials are based on the most recent Mortgage that was taken out on this home.
Original Mortgage
$471,920
Outstanding Balance
$417,846
Interest Rate
2.9%
Mortgage Type
New Conventional
Estimated Equity
$452,901
Purchase Details
Closed on
Jun 7, 2012
Sold by
Sherman Lawrence M and Sherman Ruby L
Bought by
6 Lower Road Nt and Sherman
Purchase Details
Closed on
Oct 7, 1985
Bought by
6 Lower Rd Nt
Create a Home Valuation Report for This Property
The Home Valuation Report is an in-depth analysis detailing your home's value as well as a comparison with similar homes in the area
Home Values in the Area
Average Home Value in this Area
Purchase History
| Date | Buyer | Sale Price | Title Company |
|---|---|---|---|
| Andrade Armindo | $589,900 | None Available | |
| Andrade Armindo | $589,900 | None Available | |
| 6 Lower Road Nt | -- | -- | |
| 6 Lower Road Nt | -- | -- | |
| 6 Lower Rd Nt | -- | -- |
Source: Public Records
Mortgage History
| Date | Status | Borrower | Loan Amount |
|---|---|---|---|
| Open | Andrade Armindo | $471,920 | |
| Closed | Andrade Armindo | $471,920 |
Source: Public Records
Tax History
| Year | Tax Paid | Tax Assessment Tax Assessment Total Assessment is a certain percentage of the fair market value that is determined by local assessors to be the total taxable value of land and additions on the property. | Land | Improvement |
|---|---|---|---|---|
| 2025 | $10,364 | $746,700 | $235,800 | $510,900 |
| 2024 | $10,133 | $723,800 | $214,200 | $509,600 |
| 2023 | $9,331 | $639,100 | $206,300 | $432,800 |
| 2022 | $9,294 | $586,000 | $187,500 | $398,500 |
| 2021 | $8,836 | $532,600 | $178,700 | $353,900 |
| 2020 | $8,662 | $521,500 | $175,100 | $346,400 |
| 2019 | $8,183 | $480,500 | $175,100 | $305,400 |
| 2018 | $7,972 | $465,300 | $166,700 | $298,600 |
| 2017 | $7,756 | $443,200 | $158,700 | $284,500 |
| 2016 | $7,222 | $417,700 | $158,700 | $259,000 |
| 2015 | $7,265 | $420,700 | $158,700 | $262,000 |
| 2014 | $6,984 | $400,900 | $139,100 | $261,800 |
Source: Public Records
Map
Nearby Homes
- 9 & 9A Abigail
- 7 Old North Rd
- 84 Crosby Rd
- 68 Upland Rd
- 18 Seneca Dr
- 24 Seneca Dr
- 1 Glendale Rd
- 0 Oneida Place
- 20 Beauregard Cir
- 30 Jewell Rd Unit Lot 2
- 48 Jewell Rd Unit Lot 6
- 425 Main St Unit 21D
- 304 Cox St
- 239 Reservoir St
- 0 Stevens St
- 92 Porter Rd
- 38 Airport Blvd
- 34 Forest Ave
- 28 Pierce St
- 11 Barracks Rd Unit 11
Your Personal Tour Guide
Ask me questions while you tour the home.