Estimated Value: $1,113,217 - $2,165,000
4
Beds
2
Baths
2,569
Sq Ft
$564/Sq Ft
Est. Value
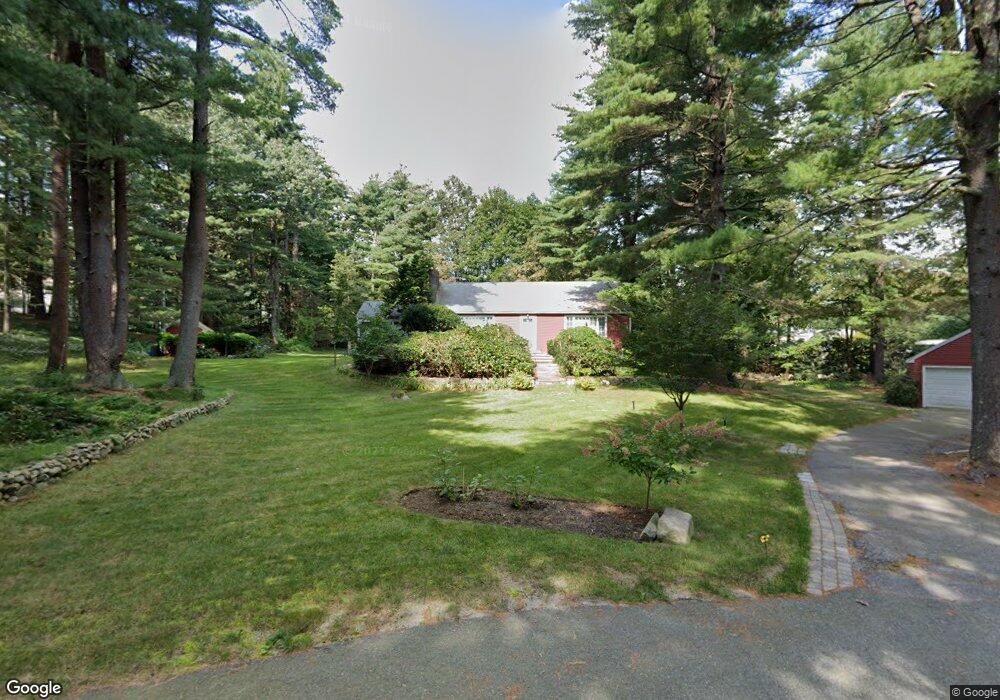
About This Home
This home is located at 6 Maple Ln, Dover, MA 02030 and is currently estimated at $1,447,804, approximately $563 per square foot. 6 Maple Ln is a home located in Norfolk County with nearby schools including Chickering Elementary School, Dover-Sherborn Regional Middle School, and Dover-Sherborn Regional High School.
Ownership History
Date
Name
Owned For
Owner Type
Purchase Details
Closed on
Jul 13, 2022
Sold by
Chin Peter K and Chin Iris K
Bought by
Peter Chin T
Current Estimated Value
Purchase Details
Closed on
Nov 25, 1988
Sold by
Kivlan Joohn P
Bought by
Chin Peter K
Home Financials for this Owner
Home Financials are based on the most recent Mortgage that was taken out on this home.
Original Mortgage
$100,000
Interest Rate
10.21%
Mortgage Type
Purchase Money Mortgage
Create a Home Valuation Report for This Property
The Home Valuation Report is an in-depth analysis detailing your home's value as well as a comparison with similar homes in the area
Home Values in the Area
Average Home Value in this Area
Purchase History
| Date | Buyer | Sale Price | Title Company |
|---|---|---|---|
| Peter Chin T | -- | None Available | |
| Chin Peter K | $320,000 | -- |
Source: Public Records
Mortgage History
| Date | Status | Borrower | Loan Amount |
|---|---|---|---|
| Previous Owner | Chin Peter K | $60,000 | |
| Previous Owner | Chin Peter K | $100,000 | |
| Previous Owner | Chin Peter K | $100,000 |
Source: Public Records
Tax History
| Year | Tax Paid | Tax Assessment Tax Assessment Total Assessment is a certain percentage of the fair market value that is determined by local assessors to be the total taxable value of land and additions on the property. | Land | Improvement |
|---|---|---|---|---|
| 2025 | $10,178 | $903,100 | $672,200 | $230,900 |
| 2024 | $9,469 | $864,000 | $650,400 | $213,600 |
| 2023 | $9,384 | $769,800 | $571,500 | $198,300 |
| 2022 | $8,925 | $718,600 | $549,700 | $168,900 |
| 2021 | $9,129 | $708,200 | $549,700 | $158,500 |
| 2020 | $9,093 | $708,200 | $549,700 | $158,500 |
| 2019 | $9,157 | $708,200 | $549,700 | $158,500 |
| 2018 | $8,960 | $697,800 | $549,700 | $148,100 |
| 2017 | $8,580 | $657,500 | $506,200 | $151,300 |
| 2016 | $8,386 | $651,100 | $506,200 | $144,900 |
| 2015 | $8,005 | $630,300 | $482,200 | $148,100 |
Source: Public Records
Map
Nearby Homes
Your Personal Tour Guide
Ask me questions while you tour the home.