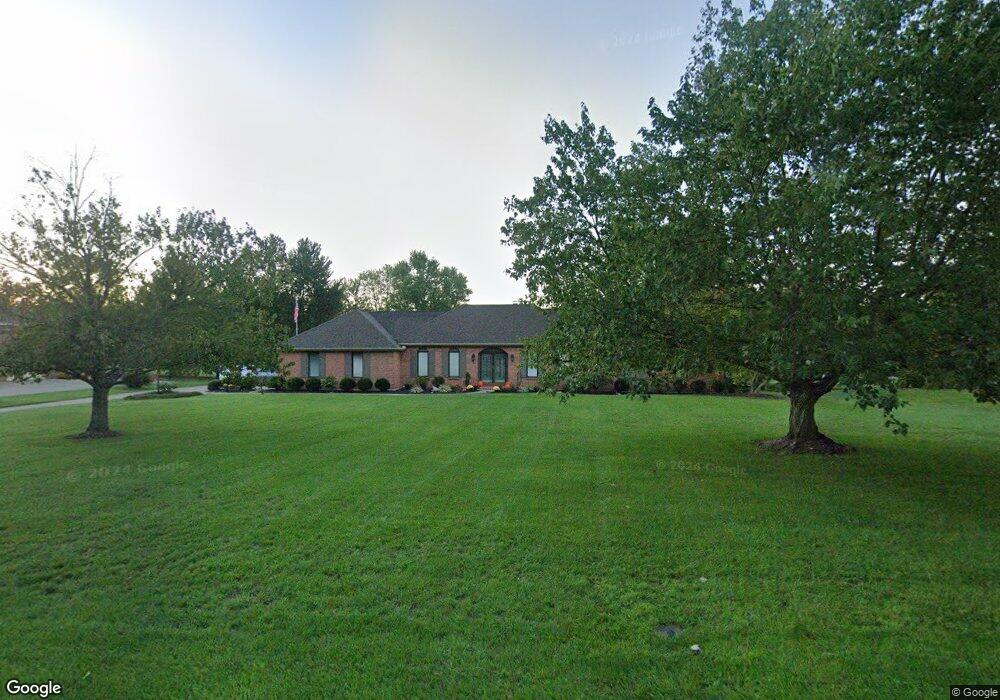
6 Maple Valley Ln Alexandria, KY 41001
Estimated Value: $377,000 - $538,000
3
Beds
3
Baths
1,887
Sq Ft
$235/Sq Ft
Est. Value
About This Home
This home is located at 6 Maple Valley Ln, Alexandria, KY 41001 and is currently estimated at $443,847, approximately $235 per square foot. 6 Maple Valley Ln is a home located in Campbell County with nearby schools including Campbell Ridge Elementary School, Campbell County Middle School, and Campbell County High School.
Ownership History
Date
Name
Owned For
Owner Type
Purchase Details
Closed on
Sep 29, 2017
Sold by
Boston Stephen W and Boston Donna Howe
Bought by
Rizzo Nina M and Sheridan David B
Current Estimated Value
Home Financials for this Owner
Home Financials are based on the most recent Mortgage that was taken out on this home.
Original Mortgage
$243,750
Outstanding Balance
$169,036
Interest Rate
3.89%
Mortgage Type
New Conventional
Estimated Equity
$274,811
Purchase Details
Closed on
Dec 14, 1999
Sold by
Fields James E
Bought by
Boston Stephen W and Boston Donna H
Home Financials for this Owner
Home Financials are based on the most recent Mortgage that was taken out on this home.
Original Mortgage
$210,000
Interest Rate
7.99%
Mortgage Type
New Conventional
Purchase Details
Closed on
Nov 19, 1996
Sold by
Brown Jeffrey E
Bought by
Fields James E and Fields Vena R
Home Financials for this Owner
Home Financials are based on the most recent Mortgage that was taken out on this home.
Original Mortgage
$75,000
Interest Rate
8.02%
Mortgage Type
New Conventional
Create a Home Valuation Report for This Property
The Home Valuation Report is an in-depth analysis detailing your home's value as well as a comparison with similar homes in the area
Home Values in the Area
Average Home Value in this Area
Purchase History
| Date | Buyer | Sale Price | Title Company |
|---|---|---|---|
| Rizzo Nina M | $325,000 | None Available | |
| Boston Stephen W | $270,000 | -- | |
| Fields James E | $232,000 | -- |
Source: Public Records
Mortgage History
| Date | Status | Borrower | Loan Amount |
|---|---|---|---|
| Open | Rizzo Nina M | $243,750 | |
| Previous Owner | Boston Stephen W | $210,000 | |
| Previous Owner | Fields James E | $75,000 |
Source: Public Records
Tax History Compared to Growth
Tax History
| Year | Tax Paid | Tax Assessment Tax Assessment Total Assessment is a certain percentage of the fair market value that is determined by local assessors to be the total taxable value of land and additions on the property. | Land | Improvement |
|---|---|---|---|---|
| 2024 | $4,288 | $355,000 | $25,000 | $330,000 |
| 2023 | $4,189 | $355,000 | $25,000 | $330,000 |
| 2022 | $3,988 | $325,000 | $25,000 | $300,000 |
| 2021 | $4,035 | $325,000 | $25,000 | $300,000 |
| 2020 | $4,094 | $325,000 | $25,000 | $300,000 |
| 2019 | $4,055 | $325,000 | $25,000 | $300,000 |
| 2018 | $4,082 | $325,000 | $20,000 | $305,000 |
| 2017 | $3,078 | $246,400 | $20,000 | $226,400 |
| 2016 | $2,969 | $246,400 | $0 | $0 |
| 2015 | $3,038 | $246,400 | $0 | $0 |
| 2014 | $3,396 | $286,200 | $0 | $0 |
Source: Public Records
Map
Nearby Homes
- 1 Saddle Ridge Trail
- 0 Persimmon Grove Pike
- 10061 Persimmon Grove Pike
- 1193 Edgewater Way
- 1194 Edgewater Way
- 1050 Lickert Rd
- 113 Clearmeadow Dr
- 4 Woodbury Ln
- 10593 Lynn Ln Unit 1
- 8 Driftwood Ct
- 42 Ridgewood Dr
- 32 Bittersweet Dr
- 10988 Dairybarn Ln
- 716 Mallard Dr
- 10997 Dairybarn Ln
- 4 Fernwood Ct
- 10743 S Licking Pike
- 12 S Bellewood Ct
- 37 Shaw Dr
- 33 Shaw Dr
- 8 Maple Valley Ln
- 4 Maple Valley Ln
- 9932 Barrs Branch Rd
- 10 Maple Valley Ln
- 3 Maple Valley Ln
- 2 Maple Valley Ln
- 9482 Persimmon Grove Pike
- 33 Maple Valley Ln Unit 33
- 5 Maple Valley Ln
- 1 Maple Valley Ln
- 12 Maple Valley Ln
- 7 Maple Valley Ln
- 9941 Barrs Branch Rd
- 9927 Barrs Branch Rd
- 9429 Persimmon Grove Pike
- 9906 Barrs Branch Rd
- 9499 Persimmon Grove Pike
- 9 Maple Valley Ln
- 14 Maple Valley Ln
- 9925 Barrs Branch Rd