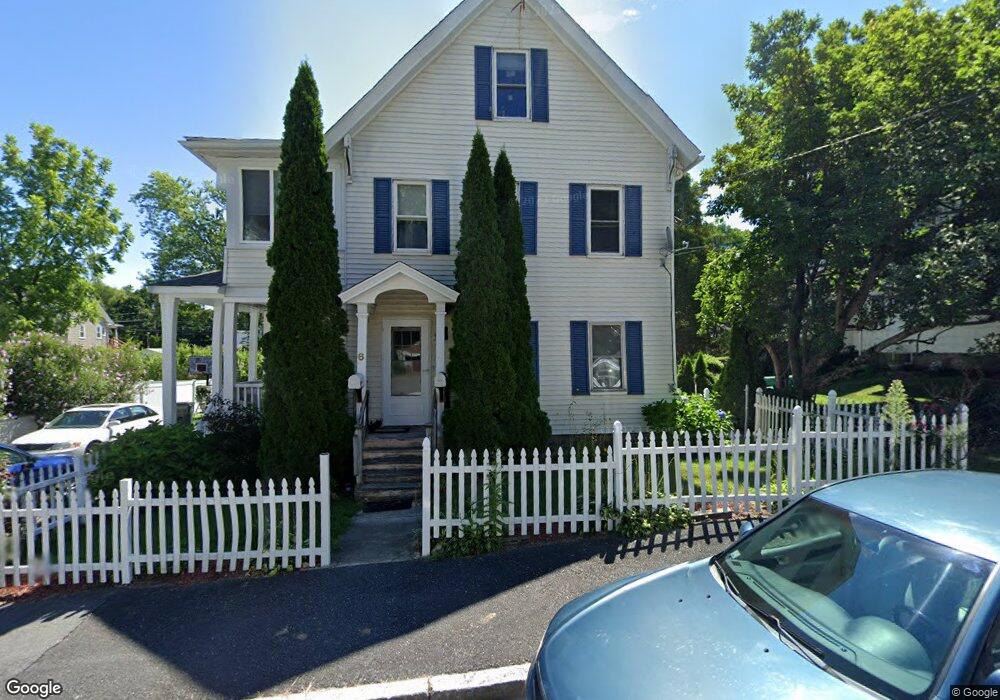
6 Mason St Hudson, MA 01749
Estimated Value: $591,000 - $607,000
4
Beds
2
Baths
2,300
Sq Ft
$261/Sq Ft
Est. Value
About This Home
This home is located at 6 Mason St, Hudson, MA 01749 and is currently estimated at $600,271, approximately $260 per square foot. 6 Mason St is a home located in Middlesex County with nearby schools including David J. Quinn Middle School, Hudson High School, and First Steps Children's Center.
Ownership History
Date
Name
Owned For
Owner Type
Purchase Details
Closed on
May 9, 1994
Sold by
Fnma
Bought by
Yorston David M
Current Estimated Value
Home Financials for this Owner
Home Financials are based on the most recent Mortgage that was taken out on this home.
Original Mortgage
$85,500
Interest Rate
7.7%
Mortgage Type
Purchase Money Mortgage
Purchase Details
Closed on
Dec 28, 1992
Sold by
Schefts Jeri S and Shawmut Mtg Co
Bought by
Federal National Mortgage Association
Create a Home Valuation Report for This Property
The Home Valuation Report is an in-depth analysis detailing your home's value as well as a comparison with similar homes in the area
Home Values in the Area
Average Home Value in this Area
Purchase History
| Date | Buyer | Sale Price | Title Company |
|---|---|---|---|
| Yorston David M | $90,000 | -- | |
| Federal National Mortgage Association | $177,368 | -- |
Source: Public Records
Mortgage History
| Date | Status | Borrower | Loan Amount |
|---|---|---|---|
| Open | Federal National Mortgage Association | $195,025 | |
| Closed | Federal National Mortgage Association | $10,000 | |
| Closed | Federal National Mortgage Association | $85,500 |
Source: Public Records
Tax History Compared to Growth
Tax History
| Year | Tax Paid | Tax Assessment Tax Assessment Total Assessment is a certain percentage of the fair market value that is determined by local assessors to be the total taxable value of land and additions on the property. | Land | Improvement |
|---|---|---|---|---|
| 2025 | $7,158 | $515,700 | $156,100 | $359,600 |
| 2024 | $6,693 | $478,100 | $141,900 | $336,200 |
| 2023 | $6,647 | $455,300 | $136,500 | $318,800 |
| 2022 | $5,737 | $361,700 | $124,100 | $237,600 |
| 2021 | $5,417 | $326,500 | $118,200 | $208,300 |
| 2020 | $5,088 | $306,300 | $115,900 | $190,400 |
| 2019 | $14,049 | $301,400 | $115,900 | $185,500 |
| 2018 | $5,035 | $287,700 | $110,300 | $177,400 |
| 2017 | $4,517 | $258,100 | $105,100 | $153,000 |
| 2016 | $3,984 | $230,400 | $105,100 | $125,300 |
| 2015 | $4,005 | $231,900 | $105,100 | $126,800 |
| 2014 | $3,850 | $221,000 | $92,100 | $128,900 |
Source: Public Records
Map
Nearby Homes
- 41 Walnut St
- 16 Houghton St
- 11 Barracks Rd Unit 11
- 32 Barracks Rd Unit 32
- 9 Barracks Rd Unit 9
- 4 Barracks Rd Unit 4
- 3 Barracks Rd Unit 3
- 7 Barracks Rd Unit 7
- 5 Barracks Rd Unit 5
- 13 Barracks Rd Unit 13
- 10 Barracks Rd Unit 10
- 16 Barnes Blvd Unit 16
- 17 School St Unit C
- 17 School St Unit A
- 65 Main St
- 34 Forest Ave
- 248 Main St Unit 207
- 248 Main St Unit 210
- 56 Park St
- 110 River St