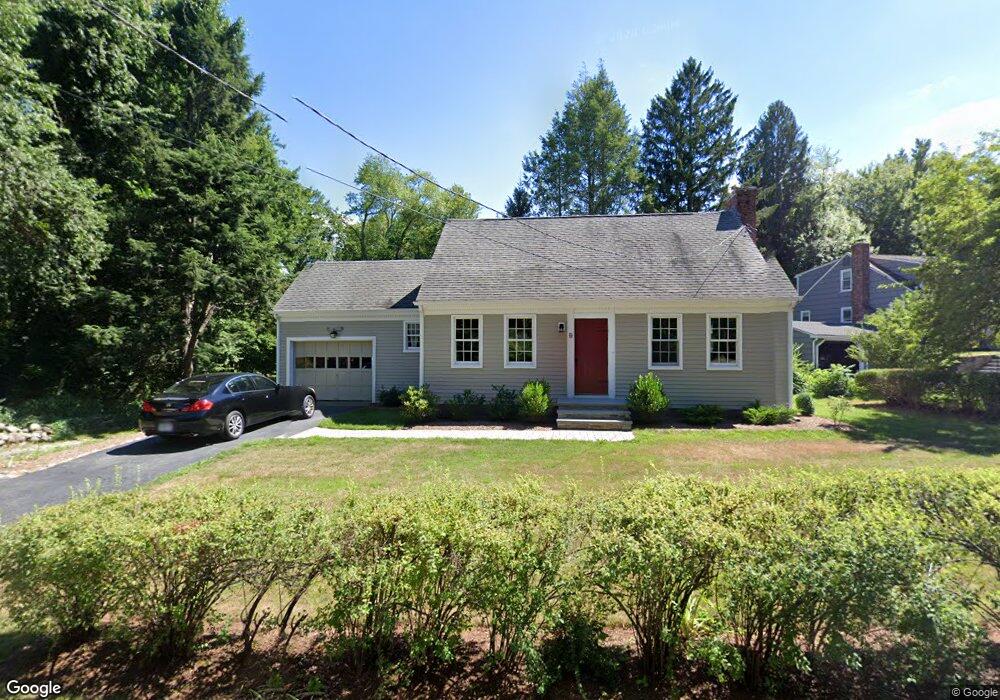
6 Maynard St Westborough, MA 01581
Estimated Value: $622,000 - $774,000
2
Beds
3
Baths
1,751
Sq Ft
$381/Sq Ft
Est. Value
About This Home
This home is located at 6 Maynard St, Westborough, MA 01581 and is currently estimated at $666,289, approximately $380 per square foot. 6 Maynard St is a home located in Worcester County with nearby schools including Westborough High School, Ebridge Montessori School, and Westboro Knowledge Beginnings.
Ownership History
Date
Name
Owned For
Owner Type
Purchase Details
Closed on
Jul 26, 2000
Sold by
Rolfe Peter A and Rolfe Susan M
Bought by
Cusson Scott J and Cosman Susan M
Current Estimated Value
Purchase Details
Closed on
Oct 25, 1991
Sold by
Steinbach Johannes P and Steinbach Rita
Bought by
Rolfe Peter A and Rolfe Susan
Create a Home Valuation Report for This Property
The Home Valuation Report is an in-depth analysis detailing your home's value as well as a comparison with similar homes in the area
Home Values in the Area
Average Home Value in this Area
Purchase History
| Date | Buyer | Sale Price | Title Company |
|---|---|---|---|
| Cusson Scott J | $250,000 | -- | |
| Rolfe Peter A | $164,000 | -- |
Source: Public Records
Mortgage History
| Date | Status | Borrower | Loan Amount |
|---|---|---|---|
| Open | Rolfe Peter A | $111,554 | |
| Closed | Rolfe Peter A | $150,000 |
Source: Public Records
Tax History
| Year | Tax Paid | Tax Assessment Tax Assessment Total Assessment is a certain percentage of the fair market value that is determined by local assessors to be the total taxable value of land and additions on the property. | Land | Improvement |
|---|---|---|---|---|
| 2025 | $8,542 | $524,400 | $305,400 | $219,000 |
| 2024 | $8,107 | $494,000 | $284,000 | $210,000 |
| 2023 | $7,789 | $462,500 | $269,200 | $193,300 |
| 2022 | $7,254 | $392,300 | $214,000 | $178,300 |
| 2021 | $6,839 | $368,900 | $190,600 | $178,300 |
| 2020 | $6,901 | $376,700 | $198,400 | $178,300 |
| 2019 | $6,593 | $359,700 | $198,400 | $161,300 |
| 2018 | $6,031 | $326,700 | $184,800 | $141,900 |
| 2017 | $5,815 | $326,700 | $184,800 | $141,900 |
| 2016 | $5,445 | $306,400 | $175,100 | $131,300 |
| 2015 | $5,361 | $288,400 | $175,100 | $113,300 |
Source: Public Records
Map
Nearby Homes
- 18 Fairview Rd
- 147 Milk St Unit 18
- 9 Shaker Way
- 155 Milk St Unit 27
- 53 Robin Rd
- 4203 Peters Farm Way Unit 4203
- 196 -198 Turnpike Rd
- 5 Wessonville Village Way Unit 5
- 64 Milk St
- 6 Folly Ln
- 7 Mayberry Dr Unit H
- 23 Water St
- 165 Turnpike Rd Unit 7
- 4 W End Ave
- 194 Milk St
- 44 South St
- 70 South St
- 9 Powder Hill Way Unit 9
- 11 Cedar St
- 192 W Main St
Your Personal Tour Guide
Ask me questions while you tour the home.