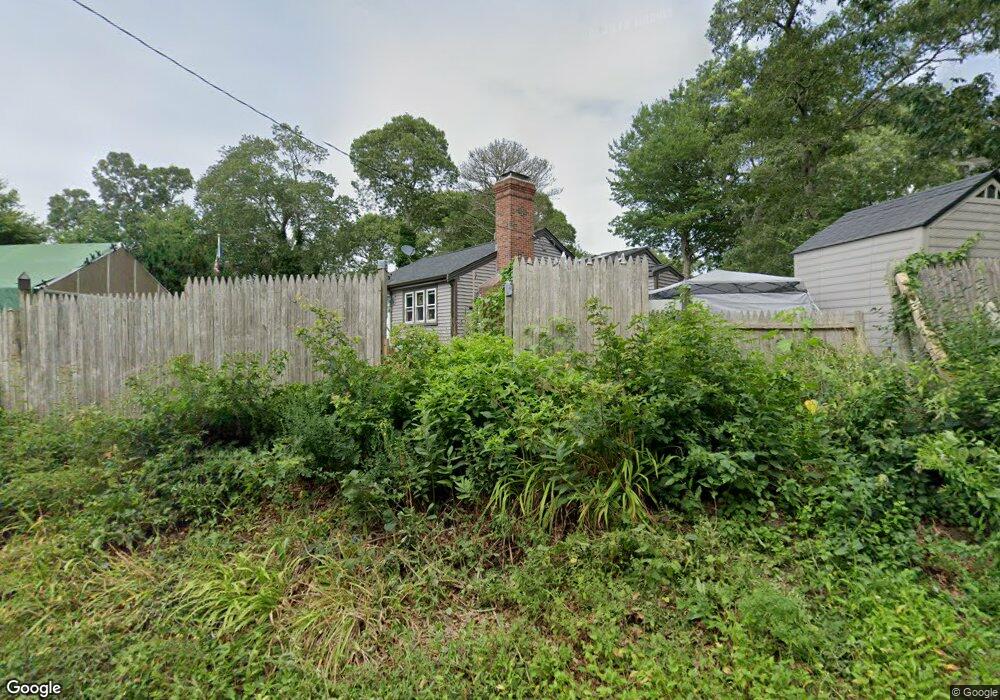
6 Mercury Ave Pocasset, MA 02559
Pocasset NeighborhoodEstimated Value: $425,000 - $472,000
2
Beds
1
Bath
650
Sq Ft
$686/Sq Ft
Est. Value
About This Home
This home is located at 6 Mercury Ave, Pocasset, MA 02559 and is currently estimated at $446,148, approximately $686 per square foot. 6 Mercury Ave is a home located in Barnstable County with nearby schools including Bourne High School, Cadence Academy Preschool - Bourne, and St Margaret Regional School.
Ownership History
Date
Name
Owned For
Owner Type
Purchase Details
Closed on
Mar 1, 1995
Sold by
Fuller Charlotte M
Bought by
Vaneeckhout Patrick
Current Estimated Value
Home Financials for this Owner
Home Financials are based on the most recent Mortgage that was taken out on this home.
Original Mortgage
$48,800
Interest Rate
8.96%
Mortgage Type
Purchase Money Mortgage
Create a Home Valuation Report for This Property
The Home Valuation Report is an in-depth analysis detailing your home's value as well as a comparison with similar homes in the area
Home Values in the Area
Average Home Value in this Area
Purchase History
| Date | Buyer | Sale Price | Title Company |
|---|---|---|---|
| Vaneeckhout Patrick | $46,000 | -- | |
| Vaneeckhout Patrick | $46,000 | -- |
Source: Public Records
Mortgage History
| Date | Status | Borrower | Loan Amount |
|---|---|---|---|
| Open | Vaneeckhout Patrick | $100,000 | |
| Closed | Vaneeckhout Patrick | $36,500 | |
| Closed | Vaneeckhout Patrick | $48,800 |
Source: Public Records
Tax History Compared to Growth
Tax History
| Year | Tax Paid | Tax Assessment Tax Assessment Total Assessment is a certain percentage of the fair market value that is determined by local assessors to be the total taxable value of land and additions on the property. | Land | Improvement |
|---|---|---|---|---|
| 2025 | $2,958 | $378,800 | $193,000 | $185,800 |
| 2024 | $2,723 | $339,500 | $200,500 | $139,000 |
| 2023 | $2,686 | $304,900 | $177,400 | $127,500 |
| 2022 | $2,486 | $246,400 | $143,900 | $102,500 |
| 2021 | $2,425 | $225,200 | $131,000 | $94,200 |
| 2020 | $2,357 | $219,500 | $129,800 | $89,700 |
| 2019 | $2,260 | $215,000 | $129,800 | $85,200 |
| 2018 | $2,183 | $207,100 | $129,200 | $77,900 |
| 2017 | $2,113 | $205,100 | $128,000 | $77,100 |
| 2016 | $2,051 | $201,900 | $128,000 | $73,900 |
| 2015 | $1,640 | $162,900 | $89,000 | $73,900 |
Source: Public Records
Map
Nearby Homes
- 7 4th Ave
- 7 Portside Dr
- 15 1st St
- 940 County Rd
- 174 Barlows Landing Rd
- 940 County Rd
- 709 County Rd
- 254 Barlows Landing Rd
- 39 Bennets Neck Dr
- 1094 County Rd
- 3 Red Brook Pond Dr
- 48 Red Brook Harbor Rd
- 22 Nairn Rd
- 1234 Route 28a
- 171 Bellavista Dr
- 1234 Route 28a
- 515 County Rd
- 16 Tara Terrace
- 501 County Rd
- 14 Navajo Rd