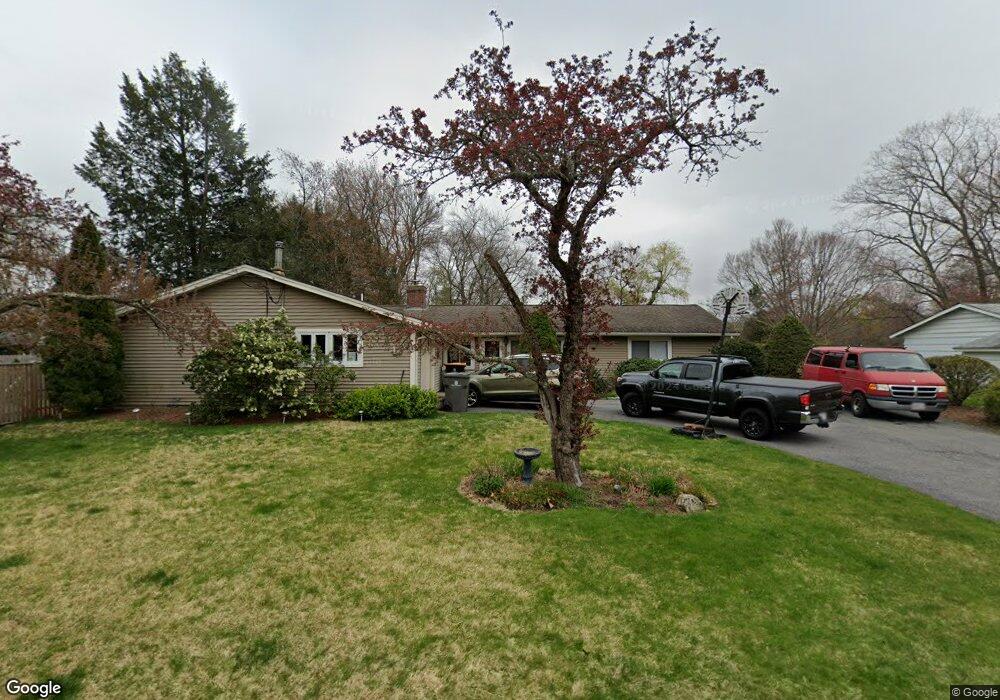
6 Michael Rd Framingham, MA 01701
Saxonville NeighborhoodEstimated Value: $668,000 - $778,000
3
Beds
4
Baths
2,526
Sq Ft
$296/Sq Ft
Est. Value
About This Home
This home is located at 6 Michael Rd, Framingham, MA 01701 and is currently estimated at $746,979, approximately $295 per square foot. 6 Michael Rd is a home located in Middlesex County with nearby schools including Framingham High School, Christa McAuliffe Charter School, and MetroWest Jewish Day School.
Ownership History
Date
Name
Owned For
Owner Type
Purchase Details
Closed on
Dec 10, 1996
Sold by
Makowski Gregory A and Makowski Monica M
Bought by
Mcdonald Kevin P and Mcdonald Elizabeth A
Current Estimated Value
Home Financials for this Owner
Home Financials are based on the most recent Mortgage that was taken out on this home.
Original Mortgage
$156,750
Interest Rate
7.83%
Mortgage Type
Purchase Money Mortgage
Purchase Details
Closed on
Aug 23, 1993
Sold by
Fitzpatrick Stephen W and Fitzpatrick Kathleen M
Bought by
Makowski Gregory A and Makowski Monica M
Create a Home Valuation Report for This Property
The Home Valuation Report is an in-depth analysis detailing your home's value as well as a comparison with similar homes in the area
Home Values in the Area
Average Home Value in this Area
Purchase History
| Date | Buyer | Sale Price | Title Company |
|---|---|---|---|
| Mcdonald Kevin P | $165,000 | -- | |
| Mcdonald Kevin P | $165,000 | -- | |
| Makowski Gregory A | $146,000 | -- | |
| Makowski Gregory A | $146,000 | -- |
Source: Public Records
Mortgage History
| Date | Status | Borrower | Loan Amount |
|---|---|---|---|
| Open | Makowski Gregory A | $171,000 | |
| Closed | Makowski Gregory A | $167,400 | |
| Closed | Makowski Gregory A | $156,750 |
Source: Public Records
Tax History Compared to Growth
Tax History
| Year | Tax Paid | Tax Assessment Tax Assessment Total Assessment is a certain percentage of the fair market value that is determined by local assessors to be the total taxable value of land and additions on the property. | Land | Improvement |
|---|---|---|---|---|
| 2025 | $7,755 | $649,500 | $271,100 | $378,400 |
| 2024 | $7,334 | $588,600 | $242,200 | $346,400 |
| 2023 | $7,061 | $539,400 | $216,100 | $323,300 |
| 2022 | $6,715 | $488,700 | $196,100 | $292,600 |
| 2021 | $6,535 | $465,100 | $188,500 | $276,600 |
| 2020 | $6,585 | $439,600 | $171,300 | $268,300 |
| 2019 | $6,435 | $418,400 | $171,300 | $247,100 |
| 2018 | $6,238 | $382,200 | $164,900 | $217,300 |
| 2017 | $6,031 | $360,900 | $160,100 | $200,800 |
| 2016 | $5,840 | $336,000 | $160,100 | $175,900 |
| 2015 | $5,993 | $336,300 | $160,700 | $175,600 |
Source: Public Records
Map
Nearby Homes
- 24 Pinewood Dr
- 81 Nicholas Rd Unit B
- 71 Nicholas Rd Unit H
- 13 Edith Rd
- 11 Edith Rd
- 19 Park Ave
- 14 Francine Rd
- 163 Water St
- 8 Elm St Unit 8A
- 29 Derby St
- 154 Danforth St
- 11 Danforth Park Rd
- 10 Victoria Garden Unit A
- 82 Joseph Rd
- 217 Central St
- 63 Landham Rd
- 0 Wagonwheel Rd
- 84 Hopestill Brown Rd
- 1376 Concord St
- 36 Brownlea Rd