6 Minnie Brown Rd Ardmore, TN 38449
Estimated Value: $104,821 - $492,000
--
Bed
1
Bath
1,453
Sq Ft
$204/Sq Ft
Est. Value
About This Home
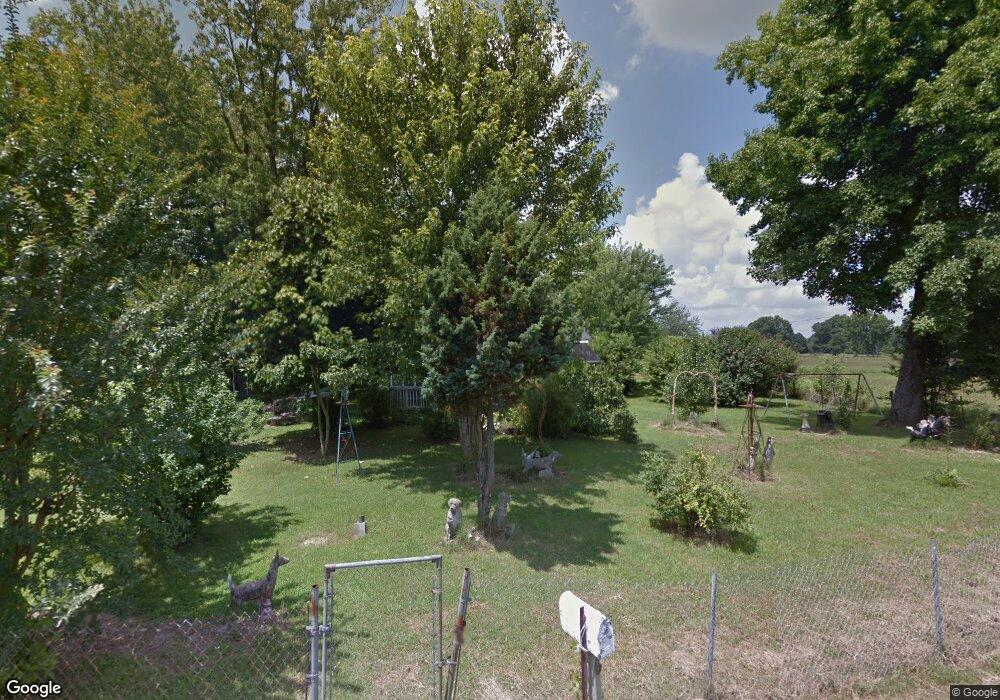
This home is located at 6 Minnie Brown Rd, Ardmore, TN 38449 and is currently estimated at $296,705, approximately $204 per square foot. 6 Minnie Brown Rd is a home located in Lincoln County with nearby schools including Blanche School, Lincoln Central Academy, and Lincoln County High School.
Ownership History
Date
Name
Owned For
Owner Type
Purchase Details
Closed on
Aug 17, 1981
Bought by
Bunn Clayton Allen
Current Estimated Value
Create a Home Valuation Report for This Property
The Home Valuation Report is an in-depth analysis detailing your home's value as well as a comparison with similar homes in the area
Home Values in the Area
Average Home Value in this Area
Purchase History
| Date | Buyer | Sale Price | Title Company |
|---|---|---|---|
| Bunn Clayton Allen | -- | -- | |
| Bunn Clayton Allen | -- | -- |
Source: Public Records
Tax History Compared to Growth
Tax History
| Year | Tax Paid | Tax Assessment Tax Assessment Total Assessment is a certain percentage of the fair market value that is determined by local assessors to be the total taxable value of land and additions on the property. | Land | Improvement |
|---|---|---|---|---|
| 2025 | $146 | $7,700 | $0 | $0 |
| 2024 | $146 | $7,700 | $7,475 | $225 |
| 2023 | $85 | $4,050 | $3,875 | $175 |
| 2022 | $85 | $4,050 | $3,875 | $175 |
| 2021 | $85 | $4,050 | $3,875 | $175 |
| 2020 | $85 | $4,050 | $3,875 | $175 |
| 2019 | $383 | $18,200 | $3,875 | $14,325 |
| 2018 | $306 | $12,325 | $3,875 | $8,450 |
| 2017 | $288 | $12,325 | $3,875 | $8,450 |
| 2016 | $288 | $12,325 | $3,875 | $8,450 |
| 2015 | -- | $12,325 | $3,875 | $8,450 |
| 2014 | $242 | $12,325 | $3,875 | $8,450 |
Source: Public Records
Map
Nearby Homes
- 1999 Ardmore Hwy
- 1997 Ardmore Hwy
- 61 Minnie Brown Rd
- 2126 Ardmore Hwy
- 113 Elliot Rd
- 167 Henry Bayless Rd
- 93 Merrill Rd
- 239 Henry Bayless Rd
- 29771 Little Creek Rd
- 30619 Highway 110
- 30A Stevenson Rd
- 30acres Stevenson Rd
- 29795 Gatlin Rd
- 30518 Fort Hampton St
- 29419 Old School House Rd
- 30176 Highway 110
- 27615 Shannon Rd
- 30679 Ardmore Ridge Rd
- 30740 Mill Race Dr
- 26081 Pheasant Run
- 9 Minnie Brown Rd
- 1993 Ardmore Hwy
- 1993 Ardmore Hwy
- 2003 Ardmore Hwy
- 11 Minnie Brown Rd
- 2005 Ardmore Hwy
- 3 Asa Smith Rd
- 13 Minnie Brown Rd
- 13 Minnie Brown Rd
- 1989 Ardmore Hwy Unit HWY1989
- 2007 Ardmore Hwy
- 1990 Ardmore Hwy
- 1986 Ardmore Hwy 110
- 9 Gatlin Rd
- 9 Gatlin Rd
- 20 Minnie Brown Rd
- 1983 Ardmore Hwy
- 10 Asa Smith Rd
- 3 Gatlin Rd
- 13 Gatlin Rd