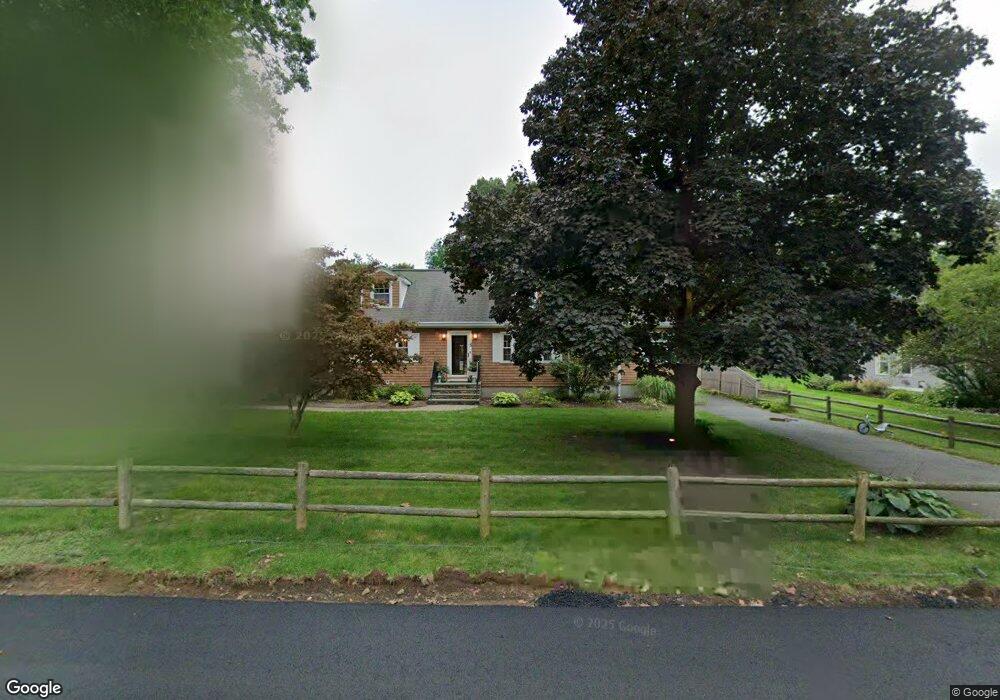
6 Moore St Natick, MA 01760
Estimated Value: $1,088,000 - $1,241,978
About This Home
This home is located at 6 Moore St, Natick, MA 01760 and is currently estimated at $1,178,495, approximately $468 per square foot. 6 Moore St is a home located in Middlesex County with nearby schools including Natick High School, Johnson Elementary School, and J F Kennedy Middle School.
Ownership History
We collect this data history from publicly available records. To have your information removed, we recommend requesting removal directly through your county’s website.
Purchase Details
Home Financials for this Owner
Home Financials are based on the most recent Mortgage that was taken out on this home.Home Values in the Area
Average Home Value in this Area
Purchase History
We collect this data history from publicly available records. To have your information removed, we recommend requesting removal directly through your county’s website.
| Date | Buyer | Sale Price | Title Company |
|---|---|---|---|
| $510,000 | -- |
Mortgage History
We collect this data history from publicly available records. To have your information removed, we recommend requesting removal directly through your county’s website.
| Date | Status | Borrower | Loan Amount |
|---|---|---|---|
| Open | $370,000 |
Tax History
We collect this data history from publicly available records. To have your information removed, we recommend requesting removal directly through your county’s website.
| Year | Tax Paid | Tax Assessment Tax Assessment Total Assessment is a certain percentage of the fair market value that is determined by local assessors to be the total taxable value of land and additions on the property. | Land | Improvement |
|---|---|---|---|---|
| 2025 | $10,654 | $890,800 | $457,400 | $433,400 |
| 2024 | $10,276 | $838,200 | $430,400 | $407,800 |
| 2023 | $10,026 | $793,200 | $411,300 | $381,900 |
| 2022 | $9,131 | $684,500 | $371,300 | $313,200 |
| 2021 | $8,785 | $645,500 | $350,100 | $295,400 |
| 2020 | $8,567 | $629,500 | $334,100 | $295,400 |
| 2019 | $8,001 | $629,500 | $334,100 | $295,400 |
| 2018 | $7,904 | $605,700 | $318,200 | $287,500 |
| 2017 | $7,552 | $559,800 | $277,800 | $282,000 |
| 2016 | $7,276 | $536,200 | $256,800 | $279,400 |
| 2015 | $7,055 | $510,500 | $256,800 | $253,700 |
Map
- 13 Sylvester Rd
- 13 Hudson St
- 4 Whitcomb St
- 25 Bunker Ln
- 10 Rockland St
- 216-218 S Main St
- 9 Morgan Dr Unit 309
- 92 Pond St
- 2 Hunters Ln
- 15 Morgan Dr Unit 205
- 11 Morgan Dr Unit 407
- 3 Joshua Path
- 6 Ambler Ct
- 9 Post Oak Ln Unit 17
- 89 Pond St
- 38 Silver Hill Ln Unit 8
- 7 Atherton St Unit 1
- 9 Silver Hill Ln Unit 19
- 11 Silver Hill Ln Unit 6
- 36 Walden Dr Unit 19
Ask me questions while you tour the home.