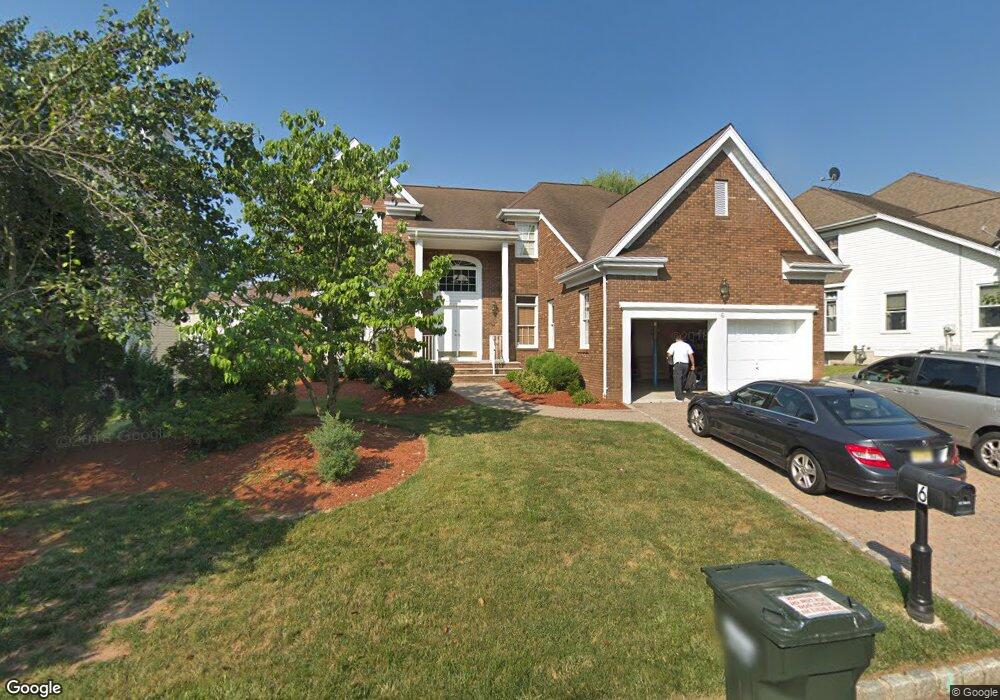
6 Morgan Way Scotch Plains, NJ 07076
Estimated Value: $943,240 - $1,533,000
--
Bed
--
Bath
3,191
Sq Ft
$372/Sq Ft
Est. Value
About This Home
This home is located at 6 Morgan Way, Scotch Plains, NJ 07076 and is currently estimated at $1,187,310, approximately $372 per square foot. 6 Morgan Way is a home located in Union County with nearby schools including J. Ackerman Coles Elementary School, Terrill Middle School, and Scotch Plains-Fanwood High School.
Ownership History
Date
Name
Owned For
Owner Type
Purchase Details
Closed on
Mar 10, 2010
Sold by
Jung Duk Yoon and Yu Jung Keum
Bought by
Shah Samar and Dahiya Shah Suman
Current Estimated Value
Home Financials for this Owner
Home Financials are based on the most recent Mortgage that was taken out on this home.
Original Mortgage
$508,000
Interest Rate
5.03%
Mortgage Type
New Conventional
Purchase Details
Closed on
Mar 5, 1999
Sold by
Bressler Seymour and Golden Bressler Elaine
Bought by
Jung Duk Yoon and Yu Jung Keum
Home Financials for this Owner
Home Financials are based on the most recent Mortgage that was taken out on this home.
Original Mortgage
$320,000
Interest Rate
6.73%
Create a Home Valuation Report for This Property
The Home Valuation Report is an in-depth analysis detailing your home's value as well as a comparison with similar homes in the area
Home Values in the Area
Average Home Value in this Area
Purchase History
| Date | Buyer | Sale Price | Title Company |
|---|---|---|---|
| Shah Samar | $635,000 | Fidelity Natl Title Ins Co | |
| Jung Duk Yoon | $430,000 | -- |
Source: Public Records
Mortgage History
| Date | Status | Borrower | Loan Amount |
|---|---|---|---|
| Previous Owner | Shah Samar | $508,000 | |
| Previous Owner | Jung Duk Yoon | $320,000 |
Source: Public Records
Tax History Compared to Growth
Tax History
| Year | Tax Paid | Tax Assessment Tax Assessment Total Assessment is a certain percentage of the fair market value that is determined by local assessors to be the total taxable value of land and additions on the property. | Land | Improvement |
|---|---|---|---|---|
| 2025 | $20,147 | $171,200 | $40,100 | $131,100 |
| 2024 | $19,553 | $171,200 | $40,100 | $131,100 |
| 2023 | $19,553 | $171,200 | $40,100 | $131,100 |
| 2022 | $19,320 | $171,200 | $40,100 | $131,100 |
| 2021 | $19,287 | $171,200 | $40,100 | $131,100 |
| 2020 | $19,195 | $171,200 | $40,100 | $131,100 |
| 2019 | $19,053 | $171,200 | $40,100 | $131,100 |
| 2018 | $18,733 | $171,200 | $40,100 | $131,100 |
| 2017 | $18,317 | $171,200 | $40,100 | $131,100 |
| 2016 | $17,964 | $171,200 | $40,100 | $131,100 |
| 2015 | $17,670 | $171,200 | $40,100 | $131,100 |
| 2014 | $17,087 | $171,200 | $40,100 | $131,100 |
Source: Public Records
Map
Nearby Homes
- 2 Dutch Ln
- 57 Rambling Dr
- 2 Brookside Ct
- 2 Unami Ln
- 1933 W Broad St
- 1933 Mary Ellen Ln
- 1701 Raritan Rd
- 1840 Raritan Rd
- 1380 Terrill Rd
- 1466 Lamberts Mill Rd
- 1621 Terrill Rd
- 2154 W Broad St
- 314 Highgate Ave
- 119 Lamberts Mill Rd
- 1840 Lake Ave
- 1148 Tanglewood Ln
- 187 King St
- 19 Highlander Dr
- 2116 Newark Ave
- 5 Robin Rd