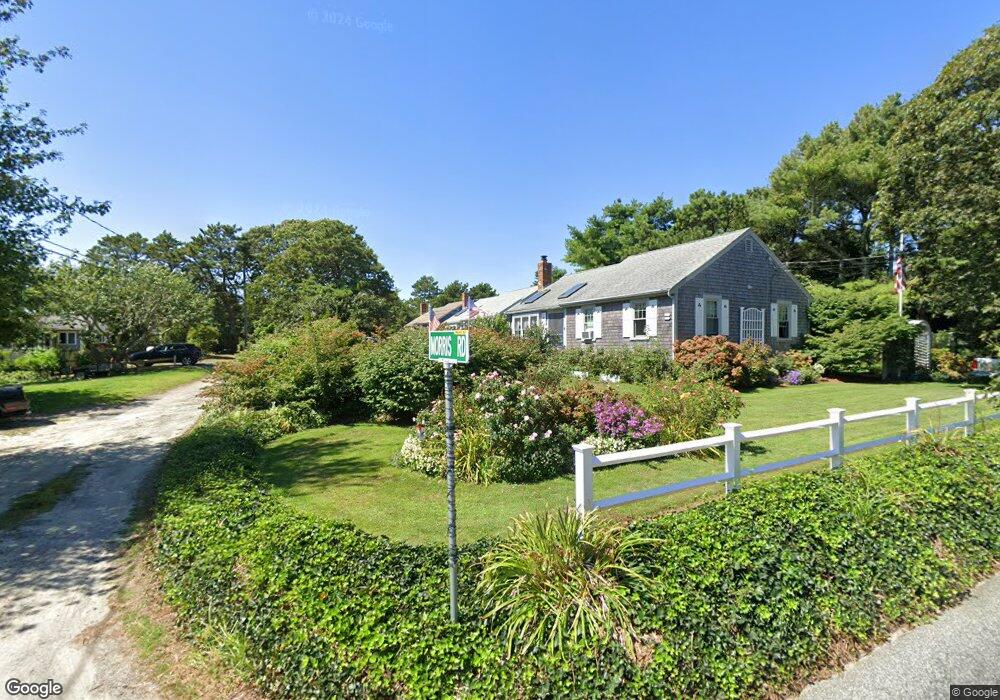
6 Morris Rd Dennis Port, MA 2639
Dennis Port NeighborhoodEstimated Value: $558,483 - $657,000
3
Beds
2
Baths
978
Sq Ft
$614/Sq Ft
Est. Value
About This Home
This home is located at 6 Morris Rd, Dennis Port, MA 2639 and is currently estimated at $600,871, approximately $614 per square foot. 6 Morris Rd is a home located in Barnstable County with nearby schools including Dennis-Yarmouth Regional High School and St. Pius X. School.
Ownership History
Date
Name
Owned For
Owner Type
Purchase Details
Closed on
May 15, 2019
Sold by
Mcphillips Sarah A Est
Bought by
Keane Nora M
Current Estimated Value
Home Financials for this Owner
Home Financials are based on the most recent Mortgage that was taken out on this home.
Original Mortgage
$276,000
Outstanding Balance
$241,669
Interest Rate
4%
Mortgage Type
New Conventional
Estimated Equity
$359,202
Purchase Details
Closed on
May 4, 2005
Sold by
Morello Katherine A and Morello Wayne R
Bought by
Mcphillips John E and Mcphillips Sarah A
Home Financials for this Owner
Home Financials are based on the most recent Mortgage that was taken out on this home.
Original Mortgage
$100,000
Interest Rate
6.01%
Mortgage Type
Purchase Money Mortgage
Create a Home Valuation Report for This Property
The Home Valuation Report is an in-depth analysis detailing your home's value as well as a comparison with similar homes in the area
Home Values in the Area
Average Home Value in this Area
Purchase History
| Date | Buyer | Sale Price | Title Company |
|---|---|---|---|
| Keane Nora M | $345,000 | -- | |
| Mcphillips John E | $320,000 | -- |
Source: Public Records
Mortgage History
| Date | Status | Borrower | Loan Amount |
|---|---|---|---|
| Open | Keane Nora M | $276,000 | |
| Previous Owner | Mcphillips John E | $100,000 |
Source: Public Records
Tax History
| Year | Tax Paid | Tax Assessment Tax Assessment Total Assessment is a certain percentage of the fair market value that is determined by local assessors to be the total taxable value of land and additions on the property. | Land | Improvement |
|---|---|---|---|---|
| 2025 | $2,136 | $493,200 | $182,900 | $310,300 |
| 2024 | $2,038 | $464,200 | $175,900 | $288,300 |
| 2023 | $1,971 | $422,100 | $159,900 | $262,200 |
| 2022 | $1,913 | $341,600 | $144,100 | $197,500 |
| 2021 | $1,832 | $303,800 | $141,200 | $162,600 |
| 2020 | $1,723 | $282,500 | $130,400 | $152,100 |
| 2019 | $1,632 | $264,500 | $127,800 | $136,700 |
| 2018 | $1,613 | $254,400 | $131,800 | $122,600 |
| 2017 | $1,478 | $240,300 | $121,700 | $118,600 |
| 2016 | $1,483 | $227,100 | $126,800 | $100,300 |
| 2015 | $1,453 | $227,100 | $126,800 | $100,300 |
| 2014 | $1,345 | $211,800 | $111,500 | $100,300 |
Source: Public Records
Map
Nearby Homes
- 18 Manning Rd
- 148 Belmont Rd
- 34 Pleasant St Unit 3
- 2 Elinor Ln
- 18 Cross St
- 157 Depot St Unit 5
- 117 Depot St
- 97 Depot St
- 67 Inman Rd Unit E
- 65 Inman Rd Unit A
- 65 Inman Rd Unit A
- 25 Riverside Dr
- 1 Belmont Rd Unit 22
- 1 Belmont Rd Unit 425
- 1 Belmont Rd Unit 630
- 1 Belmont Rd Unit 541
- 1 Belmont Rd Unit 513
- 1 Belmont Rd Unit 18
- 47 Telegraph Rd Unit 1
- 1 E Belmont Unit 513
Your Personal Tour Guide
Ask me questions while you tour the home.