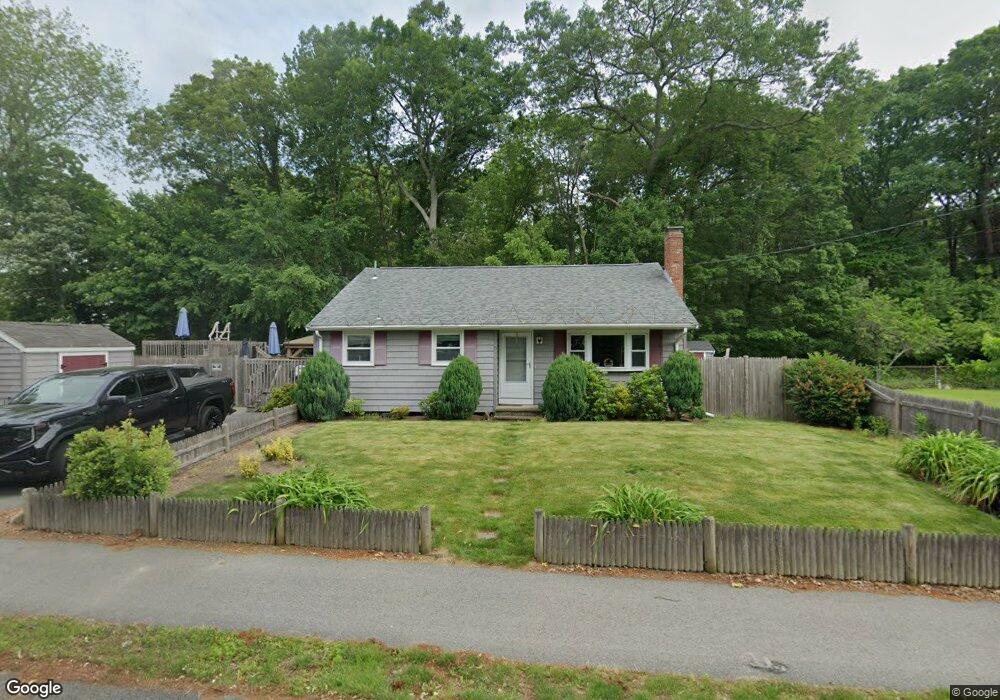
6 Morrison Rd Brockton, MA 02302
Campello NeighborhoodEstimated Value: $458,000 - $510,000
3
Beds
2
Baths
1,300
Sq Ft
$371/Sq Ft
Est. Value
About This Home
This home is located at 6 Morrison Rd, Brockton, MA 02302 and is currently estimated at $482,299, approximately $370 per square foot. 6 Morrison Rd is a home located in Plymouth County with nearby schools including Gilmore Elementary School, Davis K-8 School, and John F. Kennedy Elementary School.
Ownership History
Date
Name
Owned For
Owner Type
Purchase Details
Closed on
Jan 9, 2019
Sold by
Robbins Christy L
Bought by
Robbins Christy L and Savoie Kyle
Current Estimated Value
Purchase Details
Closed on
Dec 12, 2007
Sold by
Robbins Jared L and Robbins Christy L
Bought by
Robbins Christy L
Purchase Details
Closed on
Sep 25, 2001
Sold by
Dunn Cheryl A and Easton James E
Bought by
Robbins Jared L and Robbins Christy L
Purchase Details
Closed on
Oct 2, 1997
Sold by
Fhlmc
Bought by
Dunn Cheryl A and Easton James E
Purchase Details
Closed on
Mar 28, 1997
Sold by
Velez Faustino A and Velez Fhlmc
Bought by
Fhlmc
Create a Home Valuation Report for This Property
The Home Valuation Report is an in-depth analysis detailing your home's value as well as a comparison with similar homes in the area
Home Values in the Area
Average Home Value in this Area
Purchase History
| Date | Buyer | Sale Price | Title Company |
|---|---|---|---|
| Robbins Christy L | -- | -- | |
| Robbins Christy L | -- | -- | |
| Robbins Jared L | $186,900 | -- | |
| Dunn Cheryl A | $103,500 | -- | |
| Fhlmc | $72,000 | -- |
Source: Public Records
Mortgage History
| Date | Status | Borrower | Loan Amount |
|---|---|---|---|
| Previous Owner | Fhlmc | $256,000 | |
| Previous Owner | Fhlmc | $202,000 | |
| Previous Owner | Fhlmc | $20,000 |
Source: Public Records
Tax History
| Year | Tax Paid | Tax Assessment Tax Assessment Total Assessment is a certain percentage of the fair market value that is determined by local assessors to be the total taxable value of land and additions on the property. | Land | Improvement |
|---|---|---|---|---|
| 2025 | $5,447 | $449,800 | $158,100 | $291,700 |
| 2024 | $5,134 | $427,100 | $158,100 | $269,000 |
| 2023 | $4,733 | $364,600 | $108,300 | $256,300 |
| 2022 | $4,651 | $332,900 | $98,400 | $234,500 |
| 2021 | $4,150 | $286,200 | $90,700 | $195,500 |
| 2020 | $4,159 | $274,500 | $79,800 | $194,700 |
| 2019 | $4,012 | $258,200 | $76,000 | $182,200 |
| 2018 | $3,471 | $221,900 | $76,000 | $145,900 |
| 2017 | $3,471 | $215,600 | $76,000 | $139,600 |
| 2016 | $3,257 | $187,600 | $72,500 | $115,100 |
| 2015 | $3,154 | $173,800 | $72,500 | $101,300 |
| 2014 | $3,084 | $170,100 | $72,500 | $97,600 |
Source: Public Records
Map
Nearby Homes
Your Personal Tour Guide
Ask me questions while you tour the home.