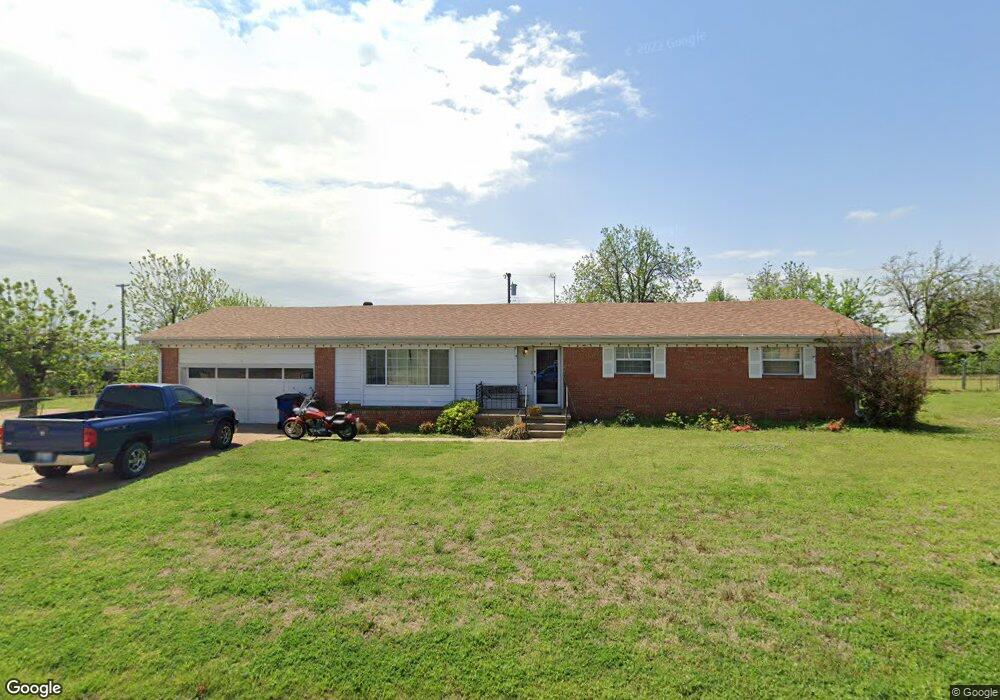
6 Morrow Dr Chickasha, OK 73018
Estimated Value: $39,909 - $204,000
3
Beds
2
Baths
1,558
Sq Ft
$97/Sq Ft
Est. Value
About This Home
This home is located at 6 Morrow Dr, Chickasha, OK 73018 and is currently estimated at $151,227, approximately $97 per square foot. 6 Morrow Dr is a home located in Grady County with nearby schools including Grand Avenue Elementary School, Chickasha Middle School, and Lincoln Elementary School.
Ownership History
Date
Name
Owned For
Owner Type
Purchase Details
Closed on
Apr 24, 2017
Sold by
Rodgers Kathie Sue and Hegwald James E
Bought by
Hegwald James E and Hegwald Samantha
Current Estimated Value
Home Financials for this Owner
Home Financials are based on the most recent Mortgage that was taken out on this home.
Original Mortgage
$50,305
Outstanding Balance
$34,103
Interest Rate
4.21%
Mortgage Type
New Conventional
Estimated Equity
$117,124
Purchase Details
Closed on
Jan 20, 2017
Sold by
Rodgers Kathie Sue and Hegwald James E
Bought by
Rodgers Kathie Sue and Hegwald James E
Purchase Details
Closed on
Nov 20, 2009
Sold by
Hegwald Mary K
Bought by
Mary K Hegwald Trust
Purchase Details
Closed on
May 20, 2002
Sold by
Miller Donald and Miller Betty
Bought by
Hegwald Mary Kathleen
Create a Home Valuation Report for This Property
The Home Valuation Report is an in-depth analysis detailing your home's value as well as a comparison with similar homes in the area
Home Values in the Area
Average Home Value in this Area
Purchase History
| Date | Buyer | Sale Price | Title Company |
|---|---|---|---|
| Hegwald James E | $22,753 | Title 68 | |
| Hegwald James E | -- | None Available | |
| Hegwald James E | $22,746 | None Available | |
| Hegwald James E | $22,753 | None Available | |
| Rodgers Kathie Sue | -- | None Available | |
| Rodgers Kathie Sue | -- | None Available | |
| Mary K Hegwald Trust | -- | None Available | |
| Hegwald Mary Kathleen | $72,000 | -- |
Source: Public Records
Mortgage History
| Date | Status | Borrower | Loan Amount |
|---|---|---|---|
| Open | Rodgers Kathie Sue | $50,305 |
Source: Public Records
Tax History Compared to Growth
Tax History
| Year | Tax Paid | Tax Assessment Tax Assessment Total Assessment is a certain percentage of the fair market value that is determined by local assessors to be the total taxable value of land and additions on the property. | Land | Improvement |
|---|---|---|---|---|
| 2025 | $760 | $8,493 | $1,795 | $6,698 |
| 2024 | $760 | $8,493 | $1,795 | $6,698 |
| 2023 | $760 | $8,246 | $1,644 | $6,602 |
| 2022 | $728 | $8,005 | $1,214 | $6,791 |
| 2021 | $804 | $8,001 | $1,214 | $6,787 |
| 2020 | $725 | $8,045 | $1,214 | $6,831 |
| 2019 | $697 | $7,902 | $1,214 | $6,688 |
| 2018 | $712 | $7,916 | $1,214 | $6,702 |
| 2017 | $692 | $7,686 | $1,214 | $6,472 |
| 2016 | $698 | $7,686 | $1,214 | $6,472 |
| 2015 | $750 | $7,900 | $1,214 | $6,686 |
| 2014 | $750 | $8,157 | $1,201 | $6,956 |
Source: Public Records
Map
Nearby Homes
- 2804 S 4th St
- 0000 E Grand Ave
- 6 Shannon Dr
- 136 Skyline Dr
- 142 Skyline Dr
- 3017 Glenwood Dr
- 3003 Lacey Dr
- 149 Skyline Dr
- 1728 S 8th St
- 3011 Heatherwood Dr
- 1527 S 6th St
- 1201 California Ave
- 523 W Country Club Rd
- 116 Saint Charles Place
- 1604 S 9th St
- 108 Saint Charles Place
- 1002 Tarry Town Dr
- 1409 W Montana Ave
- Finley Plan at Sleepy Hollow
- Alistair Plan at Sleepy Hollow