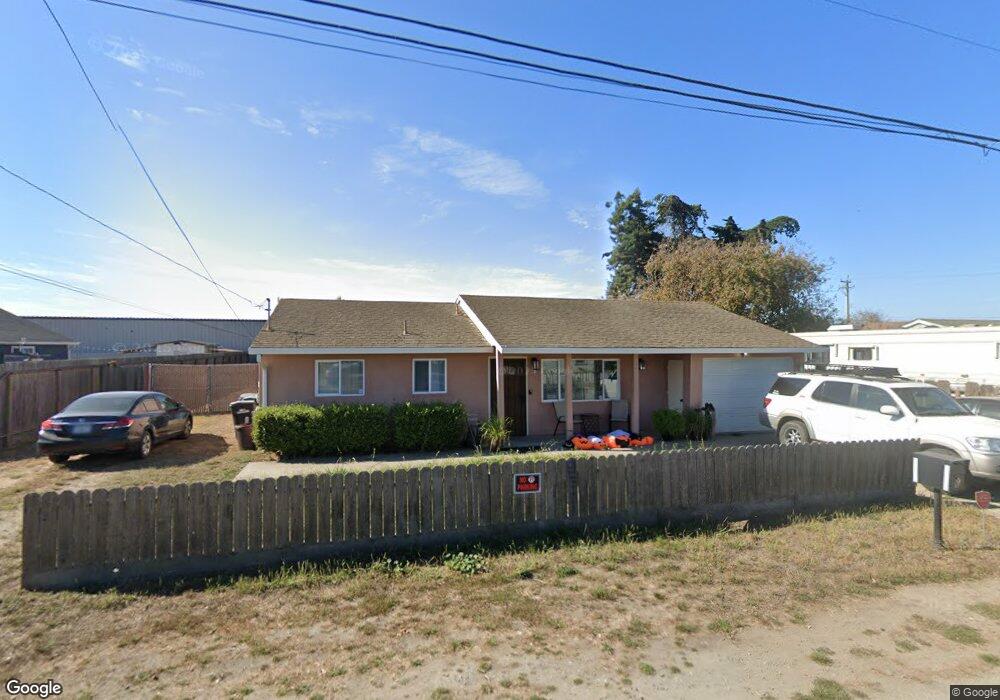
6 Muroc St Salinas, CA 93907
Boronda NeighborhoodEstimated Value: $441,000 - $635,000
3
Beds
1
Bath
1,004
Sq Ft
$568/Sq Ft
Est. Value
About This Home
This home is located at 6 Muroc St, Salinas, CA 93907 and is currently estimated at $570,384, approximately $568 per square foot. 6 Muroc St is a home located in Monterey County with nearby schools including Boronda Meadows Elementary School, Henry F. Kammann Elementary School, and Harden Middle School.
Ownership History
Date
Name
Owned For
Owner Type
Purchase Details
Closed on
Aug 23, 2022
Sold by
Aguinaga Lisa M and Aguinaga Philip S
Bought by
Vasquez Edgar and Figueroa Adriana
Current Estimated Value
Home Financials for this Owner
Home Financials are based on the most recent Mortgage that was taken out on this home.
Original Mortgage
$497,816
Interest Rate
5.66%
Mortgage Type
FHA
Purchase Details
Closed on
May 10, 1994
Sold by
Harder William W and Harder Peggy Ann
Bought by
Aguinaga Philip S and Aguinaga Lisa M
Home Financials for this Owner
Home Financials are based on the most recent Mortgage that was taken out on this home.
Original Mortgage
$94,500
Interest Rate
6.5%
Create a Home Valuation Report for This Property
The Home Valuation Report is an in-depth analysis detailing your home's value as well as a comparison with similar homes in the area
Home Values in the Area
Average Home Value in this Area
Purchase History
| Date | Buyer | Sale Price | Title Company |
|---|---|---|---|
| Vasquez Edgar | $507,000 | Wfg Title Company | |
| Aguinaga Philip S | $105,000 | Old Republic Title Company |
Source: Public Records
Mortgage History
| Date | Status | Borrower | Loan Amount |
|---|---|---|---|
| Previous Owner | Vasquez Edgar | $497,816 | |
| Previous Owner | Aguinaga Philip S | $94,500 |
Source: Public Records
Tax History Compared to Growth
Tax History
| Year | Tax Paid | Tax Assessment Tax Assessment Total Assessment is a certain percentage of the fair market value that is determined by local assessors to be the total taxable value of land and additions on the property. | Land | Improvement |
|---|---|---|---|---|
| 2025 | $6,347 | $527,482 | $270,504 | $256,978 |
| 2024 | $6,347 | $517,140 | $265,200 | $251,940 |
| 2023 | $5,865 | $507,000 | $260,000 | $247,000 |
| 2022 | $1,958 | $507,000 | $260,000 | $247,000 |
| 2021 | $2,691 | $164,838 | $102,044 | $62,794 |
| 2020 | $2,682 | $163,149 | $100,998 | $62,151 |
| 2019 | $2,623 | $159,951 | $99,018 | $60,933 |
| 2018 | $2,558 | $156,816 | $97,077 | $59,739 |
| 2017 | $2,543 | $153,742 | $95,174 | $58,568 |
| 2016 | $2,532 | $150,728 | $93,308 | $57,420 |
| 2015 | $2,535 | $148,465 | $91,907 | $56,558 |
| 2014 | $2,402 | $145,558 | $90,107 | $55,451 |
Source: Public Records
Map
Nearby Homes
- 1055 Howe Cir
- 424 Brighton St
- 983 Flint Way
- 515 Stockton St
- 1226 Monroe St
- 350 Victor St
- 549 Powell St
- 417 Tyler Place Unit I
- 1518 Duran Cir
- 9 Young Dr
- 1588 Cherokee Dr
- 216 Crescent Way
- 114 Iris Dr
- 1117 Baldwin St Unit 6
- 1117 Baldwin St Unit 5
- 29 Buena Vista St
- 129 Rodeo Ave
- 840 Archer St
- 1690 Cherokee Dr
- 1634 Cuevas Cir Unit 5