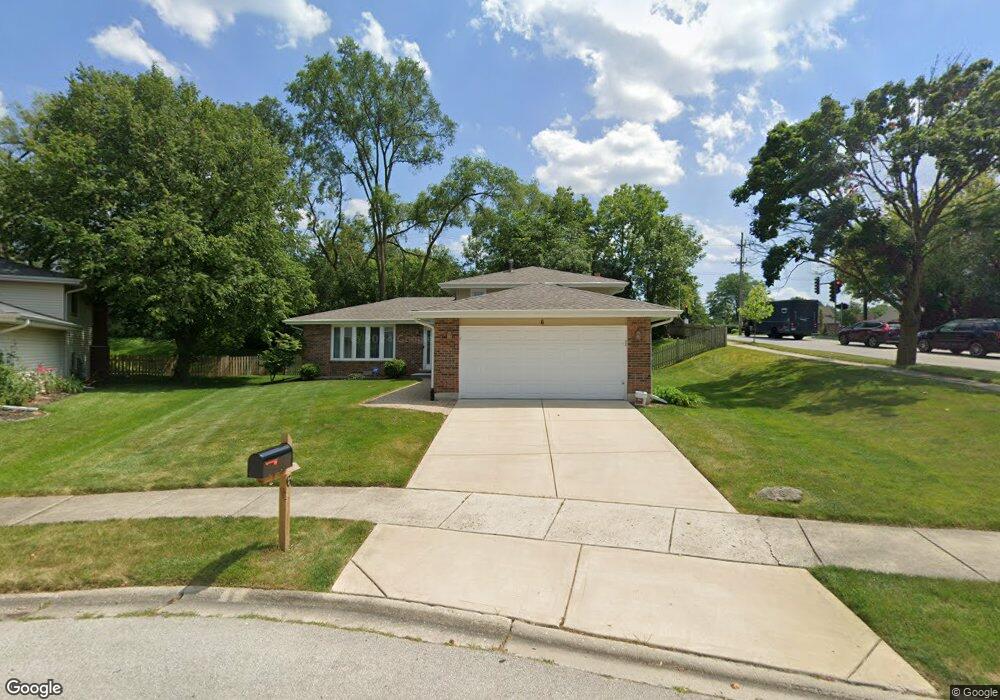
6 N Charles St Naperville, IL 60540
East Naperville NeighborhoodEstimated Value: $460,000 - $557,000
3
Beds
2
Baths
1,699
Sq Ft
$309/Sq Ft
Est. Value
About This Home
This home is located at 6 N Charles St, Naperville, IL 60540 and is currently estimated at $525,451, approximately $309 per square foot. 6 N Charles St is a home located in DuPage County with nearby schools including Highlands Elementary School, Kennedy Junior High School, and Naperville North High School.
Ownership History
Date
Name
Owned For
Owner Type
Purchase Details
Closed on
Dec 2, 2019
Sold by
Johnson Robert T and Johnson Sherry M
Bought by
Smith Daniel and Smith Scott
Current Estimated Value
Purchase Details
Closed on
May 28, 1999
Sold by
Evavold Allan L and Evavold June E
Bought by
Johnson Robert J and Johnson Sherry M
Home Financials for this Owner
Home Financials are based on the most recent Mortgage that was taken out on this home.
Original Mortgage
$183,340
Interest Rate
6.94%
Mortgage Type
VA
Create a Home Valuation Report for This Property
The Home Valuation Report is an in-depth analysis detailing your home's value as well as a comparison with similar homes in the area
Home Values in the Area
Average Home Value in this Area
Purchase History
We collect this data history from publicly available records. To have your information removed, we recommend requesting removal directly through your county’s website.
| Date | Buyer | Sale Price | Title Company |
|---|---|---|---|
| Smith Daniel | $290,000 | Attorneys Ttl Guaranty Fund | |
| Johnson Robert J | $178,000 | First American Title Ins |
Source: Public Records
Mortgage History
We collect this data history from publicly available records. To have your information removed, we recommend requesting removal directly through your county’s website.
| Date | Status | Borrower | Loan Amount |
|---|---|---|---|
| Previous Owner | Johnson Robert J | $183,340 |
Source: Public Records
Tax History
| Year | Tax Paid | Tax Assessment Tax Assessment Total Assessment is a certain percentage of the fair market value that is determined by local assessors to be the total taxable value of land and additions on the property. | Land | Improvement |
|---|---|---|---|---|
| 2024 | $7,555 | $131,320 | $59,606 | $71,714 |
| 2023 | $7,268 | $119,850 | $54,400 | $65,450 |
| 2022 | $7,151 | $116,500 | $52,880 | $63,620 |
| 2021 | $6,886 | $112,090 | $50,880 | $61,210 |
| 2020 | $6,738 | $110,080 | $49,970 | $60,110 |
| 2019 | $6,537 | $105,320 | $47,810 | $57,510 |
| 2018 | $6,104 | $98,710 | $44,810 | $53,900 |
| 2017 | $5,977 | $95,380 | $43,300 | $52,080 |
| 2016 | $5,853 | $91,930 | $41,730 | $50,200 |
| 2015 | $5,808 | $86,570 | $39,300 | $47,270 |
| 2014 | $5,411 | $78,700 | $35,730 | $42,970 |
| 2013 | $5,330 | $78,890 | $35,820 | $43,070 |
Source: Public Records
Map
Nearby Homes
- 932 E Chicago Ave
- 130 N Huffman St
- 304 Camarie Ct
- 1056 Mattande Ln
- 15 S Huffman St
- 104 N Julian St
- 309 White Oak Dr
- 121 N Julian St
- 829 E Porter Ave
- 941 Coletta Cir
- 903 Coletta Cir
- 226 S Columbia St
- 5 N Columbia St
- 23 N Columbia St
- 1076 Prairie Ave
- 1315 Dunrobin Rd
- 211 N Wright St
- 1324 Jane Ave
- 515 North Ave
- 488 S Columbia St
- 10 N Charles St
- 1040 Jupiter Ct
- 14 N Charles St
- 4 S Charles Ave
- 25W790 E Chicago Ave
- 22 N Charles St
- 18 N Charles St
- 1039 Jupiter Ct
- 1036 Jupiter Ct
- 1 Kingsbridge Cir
- 8 S Charles Ave
- 1035 Jupiter Ct
- 1032 Jupiter Ct
- 1108 E Chicago Ave
- 21 N Charles Ave
- 21 N Charles St
- 123 Kingsbridge Cir
- 131 Kingsbridge Cir
- 1031 Jupiter Ct
- 1158 Peachtree Ct
Your Personal Tour Guide
Ask me questions while you tour the home.