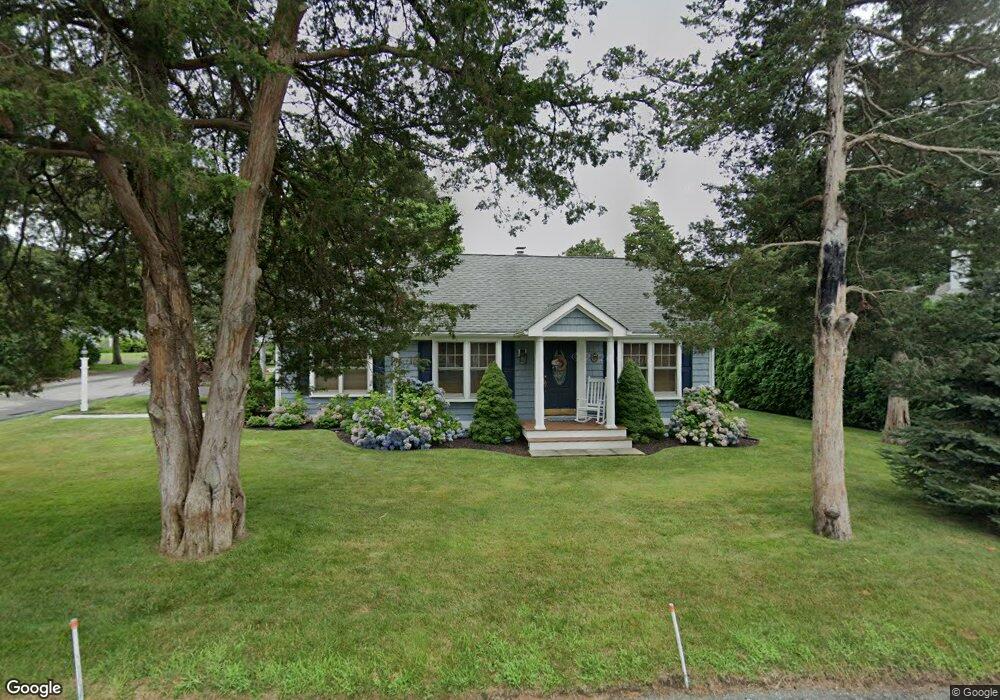
6 N Shore Rd Pocasset, MA 02559
Pocasset NeighborhoodEstimated Value: $854,000 - $929,000
3
Beds
2
Baths
1,464
Sq Ft
$606/Sq Ft
Est. Value
About This Home
This home is located at 6 N Shore Rd, Pocasset, MA 02559 and is currently estimated at $887,560, approximately $606 per square foot. 6 N Shore Rd is a home located in Barnstable County with nearby schools including Bourne High School and Cadence Academy Preschool - Bourne.
Ownership History
Date
Name
Owned For
Owner Type
Purchase Details
Closed on
Dec 14, 2021
Sold by
Carlson Barry C and Carlson Sheryl L
Bought by
Ledwith Brian E and Ledwith Kerry A
Current Estimated Value
Home Financials for this Owner
Home Financials are based on the most recent Mortgage that was taken out on this home.
Original Mortgage
$572,000
Outstanding Balance
$519,301
Interest Rate
2.5%
Mortgage Type
Purchase Money Mortgage
Estimated Equity
$368,259
Purchase Details
Closed on
Feb 9, 2007
Sold by
Copeland George L
Bought by
Carlson Barry C and Carlson Sheryl L
Create a Home Valuation Report for This Property
The Home Valuation Report is an in-depth analysis detailing your home's value as well as a comparison with similar homes in the area
Home Values in the Area
Average Home Value in this Area
Purchase History
| Date | Buyer | Sale Price | Title Company |
|---|---|---|---|
| Ledwith Brian E | $715,000 | None Available | |
| Ledwith Brian E | $715,000 | None Available | |
| Carlson Barry C | $299,900 | -- | |
| Carlson Barry C | $299,900 | -- |
Source: Public Records
Mortgage History
| Date | Status | Borrower | Loan Amount |
|---|---|---|---|
| Open | Ledwith Brian E | $572,000 | |
| Closed | Ledwith Brian E | $572,000 |
Source: Public Records
Tax History Compared to Growth
Tax History
| Year | Tax Paid | Tax Assessment Tax Assessment Total Assessment is a certain percentage of the fair market value that is determined by local assessors to be the total taxable value of land and additions on the property. | Land | Improvement |
|---|---|---|---|---|
| 2025 | $6,146 | $787,000 | $429,700 | $357,300 |
| 2024 | $6,010 | $749,400 | $409,200 | $340,200 |
| 2023 | $5,488 | $622,900 | $318,700 | $304,200 |
| 2022 | $4,606 | $456,500 | $250,000 | $206,500 |
| 2021 | $4,475 | $415,500 | $227,500 | $188,000 |
| 2020 | $4,257 | $396,400 | $225,300 | $171,100 |
| 2019 | $4,085 | $388,700 | $225,300 | $163,400 |
| 2018 | $3,961 | $375,800 | $220,100 | $155,700 |
| 2017 | $4,133 | $401,300 | $239,800 | $161,500 |
| 2016 | $3,814 | $375,400 | $218,000 | $157,400 |
| 2015 | $3,780 | $375,400 | $218,000 | $157,400 |
Source: Public Records
Map
Nearby Homes