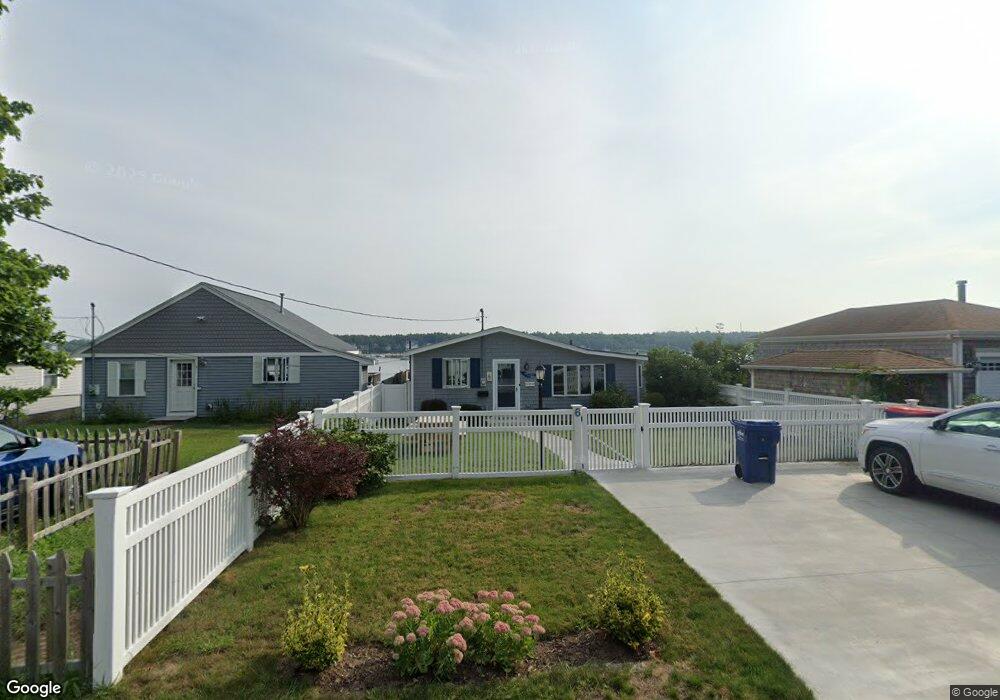
6 Nimrod Way Wareham, MA 02571
Wareham Center NeighborhoodEstimated Value: $462,000 - $578,000
1
Bed
1
Bath
1,043
Sq Ft
$505/Sq Ft
Est. Value
About This Home
This home is located at 6 Nimrod Way, Wareham, MA 02571 and is currently estimated at $526,787, approximately $505 per square foot. 6 Nimrod Way is a home located in Plymouth County.
Ownership History
Date
Name
Owned For
Owner Type
Purchase Details
Closed on
Dec 28, 2022
Sold by
Karp Robert and Karp Margaret A
Bought by
6 Nimrod Way Rt and Karp
Current Estimated Value
Purchase Details
Closed on
Aug 17, 1990
Sold by
Mary E Est Kelly
Bought by
Karp Robert
Home Financials for this Owner
Home Financials are based on the most recent Mortgage that was taken out on this home.
Original Mortgage
$62,000
Interest Rate
9.96%
Mortgage Type
Purchase Money Mortgage
Create a Home Valuation Report for This Property
The Home Valuation Report is an in-depth analysis detailing your home's value as well as a comparison with similar homes in the area
Home Values in the Area
Average Home Value in this Area
Purchase History
| Date | Buyer | Sale Price | Title Company |
|---|---|---|---|
| 6 Nimrod Way Rt | -- | None Available | |
| 6 Nimrod Way Rt | -- | None Available | |
| Karp Robert | $114,000 | -- | |
| Karp Robert | $114,000 | -- |
Source: Public Records
Mortgage History
| Date | Status | Borrower | Loan Amount |
|---|---|---|---|
| Previous Owner | Karp Robert | $62,000 |
Source: Public Records
Tax History
| Year | Tax Paid | Tax Assessment Tax Assessment Total Assessment is a certain percentage of the fair market value that is determined by local assessors to be the total taxable value of land and additions on the property. | Land | Improvement |
|---|---|---|---|---|
| 2025 | $5,666 | $543,800 | $358,800 | $185,000 |
| 2024 | $5,170 | $460,400 | $271,400 | $189,000 |
| 2023 | $4,989 | $414,700 | $246,700 | $168,000 |
| 2022 | $5,023 | $381,100 | $246,700 | $134,400 |
| 2021 | $5,041 | $374,800 | $246,700 | $128,100 |
| 2020 | $4,831 | $364,300 | $246,700 | $117,600 |
| 2019 | $4,269 | $321,200 | $202,700 | $118,500 |
| 2018 | $4,172 | $306,100 | $202,700 | $103,400 |
| 2017 | $3,848 | $286,100 | $202,700 | $83,400 |
| 2016 | $3,577 | $264,400 | $192,600 | $71,800 |
| 2015 | $3,456 | $264,400 | $192,600 | $71,800 |
| 2014 | $3,371 | $262,300 | $183,100 | $79,200 |
Source: Public Records
Map
Nearby Homes
- 106 Circuit Ave
- 10 Oak St
- 15 Broadmarsh Ave
- 6 Allen Ave
- 20 Grant St
- 43 Shore Ave
- 3 Hazel St
- 6 Pine St
- 4 Mather Dr
- 6 Wildwood Ave
- 55 Minot Ave Unit 55
- 3 Cranberry Grove Way Unit C
- 21 Bayview St
- 10 Barnes St
- 110 Mayflower Ridge Dr
- 10 Longmeadow Dr
- 6 Bourne Terrace
- 437 Main St
- 156 Sandwich Rd
- 233 Marion Rd
Your Personal Tour Guide
Ask me questions while you tour the home.