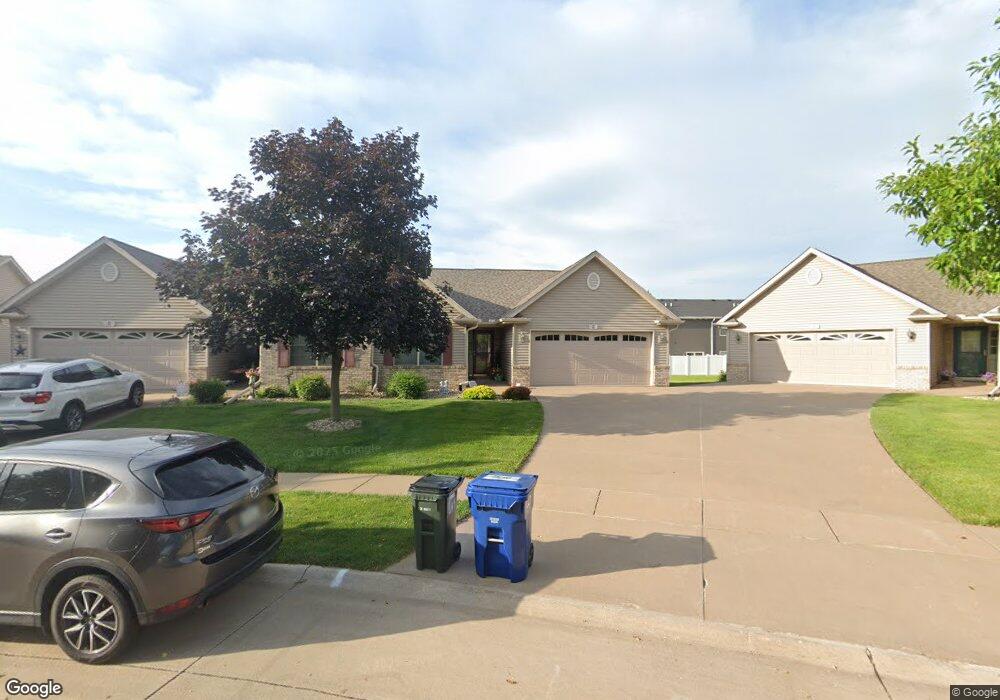
6 Northwest Crossing Davenport, IA 52806
North Side NeighborhoodEstimated Value: $272,339 - $336,000
2
Beds
2
Baths
1,404
Sq Ft
$217/Sq Ft
Est. Value
About This Home
This home is located at 6 Northwest Crossing, Davenport, IA 52806 and is currently estimated at $305,335, approximately $217 per square foot. 6 Northwest Crossing is a home located in Scott County with nearby schools including Cumberland Hall School, Harrison Elementary School, and Academy Of Continuing Education.
Ownership History
Date
Name
Owned For
Owner Type
Purchase Details
Closed on
Sep 15, 2014
Sold by
Kopp Steven P and Glover Linda S
Bought by
Black Darrell E and Black Marlene R
Current Estimated Value
Home Financials for this Owner
Home Financials are based on the most recent Mortgage that was taken out on this home.
Original Mortgage
$294,000
Outstanding Balance
$225,159
Interest Rate
4.15%
Mortgage Type
Reverse Mortgage Home Equity Conversion Mortgage
Estimated Equity
$80,176
Purchase Details
Closed on
Jan 17, 2013
Sold by
Kopp Mary J
Bought by
Mary J Kopp Trust
Purchase Details
Closed on
Aug 31, 2010
Sold by
Heath Elton M
Bought by
Kapp Mary J
Purchase Details
Closed on
Aug 15, 2005
Sold by
Dolans 53Rd Street L L C
Bought by
Heath Elton M
Home Financials for this Owner
Home Financials are based on the most recent Mortgage that was taken out on this home.
Original Mortgage
$63,600
Interest Rate
5.8%
Mortgage Type
New Conventional
Create a Home Valuation Report for This Property
The Home Valuation Report is an in-depth analysis detailing your home's value as well as a comparison with similar homes in the area
Home Values in the Area
Average Home Value in this Area
Purchase History
| Date | Buyer | Sale Price | Title Company |
|---|---|---|---|
| Black Darrell E | $196,000 | None Available | |
| Mary J Kopp Trust | -- | None Available | |
| Kapp Mary J | $190,000 | None Available | |
| Heath Elton M | $182,000 | None Available |
Source: Public Records
Mortgage History
| Date | Status | Borrower | Loan Amount |
|---|---|---|---|
| Open | Black Darrell E | $294,000 | |
| Previous Owner | Heath Elton M | $63,600 |
Source: Public Records
Tax History Compared to Growth
Tax History
| Year | Tax Paid | Tax Assessment Tax Assessment Total Assessment is a certain percentage of the fair market value that is determined by local assessors to be the total taxable value of land and additions on the property. | Land | Improvement |
|---|---|---|---|---|
| 2025 | $3,980 | $259,360 | $29,560 | $229,800 |
| 2024 | $3,996 | $246,590 | $29,560 | $217,030 |
| 2023 | $4,402 | $246,590 | $29,560 | $217,030 |
| 2022 | $4,420 | $214,980 | $29,560 | $185,420 |
| 2021 | $4,420 | $214,980 | $29,560 | $185,420 |
| 2020 | $4,370 | $209,960 | $29,560 | $180,400 |
| 2019 | $4,294 | $199,940 | $29,560 | $170,380 |
| 2018 | $4,200 | $199,940 | $29,560 | $170,380 |
| 2017 | $4,086 | $199,940 | $29,560 | $170,380 |
| 2016 | $3,920 | $187,690 | $0 | $0 |
| 2015 | $3,920 | $169,660 | $0 | $0 |
| 2014 | $3,768 | $169,660 | $0 | $0 |
| 2013 | $3,704 | $0 | $0 | $0 |
| 2012 | -- | $178,170 | $39,550 | $138,620 |
Source: Public Records
Map
Nearby Homes
- 5436 N Division St
- 5510 N Division St
- 1729 Welshire Dr
- 5210 N Division St
- 5721 Taylor St
- 1415 W 59th St
- 5735 Taylor St
- 5804 Lillie Ave
- 4705 N Sturdevant St
- 1927 W 55th St
- 1033 W 58th St
- 4757 Willow Cir
- 4743 Willow Cir
- 4618 Fillmore Ln
- 1005 W 58th St
- 4804 Northwest Blvd
- 1301 W 62nd Ct
- 2127 W 51st St
- 825 Northbrook Dr
- 4942 Brown St
- 6 Northwest Crossing
- 5 Northwest Crossing
- 5 Northwest Crossing
- 7 Northwest Crossing
- 7 Northwest Crossing
- 4 Northwest Crossing
- 8 Northwest Crossing
- 3 Northwest Crossing
- 9 Northwest Crossing
- 25 Northwest Crossing
- 25 Northwest Crossing
- 2 Northwest Crossing
- 10 Northwest Crossing
- 10 Northwest Crossing
- 26 Northwest Crossing
- 26 Northwest Crossing
- 27 Northwest Crossing
- 11 Northwest Crossing
- 11 Northwest Crossing
- 5401 Villa Ct