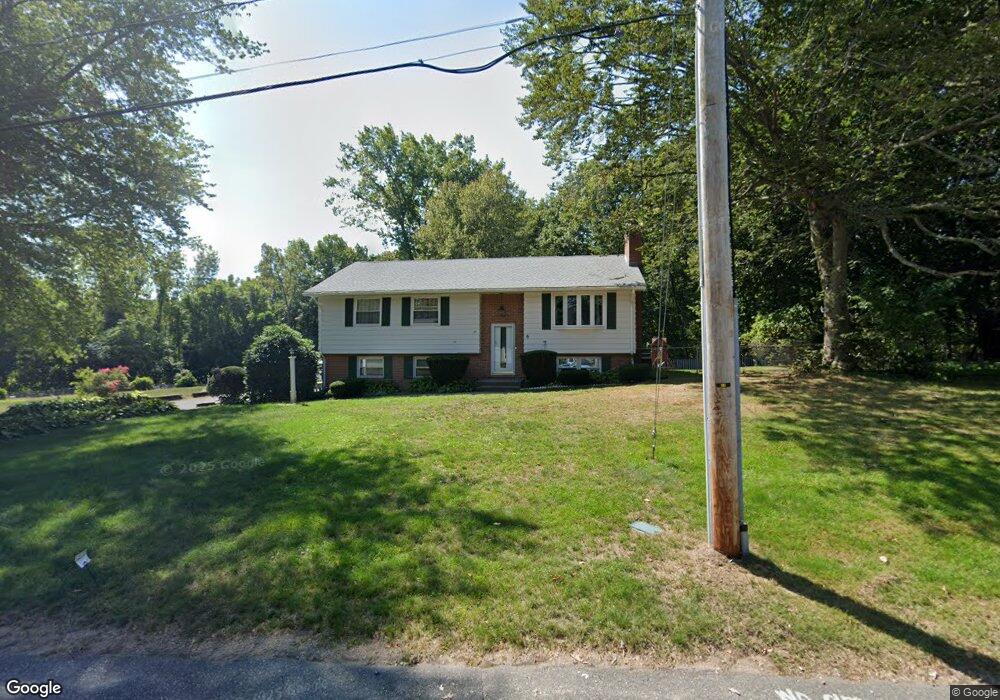
6 Paul St South Hadley, MA 01075
Estimated Value: $352,000 - $409,487
3
Beds
3
Baths
1,128
Sq Ft
$338/Sq Ft
Est. Value
About This Home
This home is located at 6 Paul St, South Hadley, MA 01075 and is currently estimated at $380,872, approximately $337 per square foot. 6 Paul St is a home located in Hampshire County with nearby schools including Plains Elementary School, Mosier Elementary School, and Michael E. Smith Middle School.
Ownership History
Date
Name
Owned For
Owner Type
Purchase Details
Closed on
Nov 30, 2021
Sold by
Hogan Derek W and Hogan Larry S
Bought by
Brochu Robin L
Current Estimated Value
Home Financials for this Owner
Home Financials are based on the most recent Mortgage that was taken out on this home.
Original Mortgage
$308,750
Outstanding Balance
$283,740
Interest Rate
3.05%
Mortgage Type
Purchase Money Mortgage
Estimated Equity
$97,132
Purchase Details
Closed on
May 25, 2016
Sold by
Hogan William J and Hogan Suzanne R
Bought by
Hogan Derek W and Hogan Larry S
Purchase Details
Closed on
Jun 28, 1976
Bought by
Hogan William J and Hogan Suzanne R
Create a Home Valuation Report for This Property
The Home Valuation Report is an in-depth analysis detailing your home's value as well as a comparison with similar homes in the area
Home Values in the Area
Average Home Value in this Area
Purchase History
| Date | Buyer | Sale Price | Title Company |
|---|---|---|---|
| Brochu Robin L | $325,000 | None Available | |
| Hogan Derek W | -- | -- | |
| Hogan William J | -- | -- |
Source: Public Records
Mortgage History
| Date | Status | Borrower | Loan Amount |
|---|---|---|---|
| Open | Brochu Robin L | $308,750 | |
| Previous Owner | Hogan William J | $25,000 | |
| Previous Owner | Hogan William J | $85,000 | |
| Previous Owner | Hogan William J | $35,000 | |
| Previous Owner | Hogan William J | $75,000 |
Source: Public Records
Tax History Compared to Growth
Tax History
| Year | Tax Paid | Tax Assessment Tax Assessment Total Assessment is a certain percentage of the fair market value that is determined by local assessors to be the total taxable value of land and additions on the property. | Land | Improvement |
|---|---|---|---|---|
| 2025 | $5,916 | $371,400 | $123,600 | $247,800 |
| 2024 | $5,814 | $349,200 | $115,600 | $233,600 |
| 2023 | $5,221 | $297,500 | $104,700 | $192,800 |
| 2022 | $4,395 | $237,800 | $104,700 | $133,100 |
| 2021 | $4,332 | $222,600 | $98,200 | $124,400 |
| 2020 | $4,265 | $213,900 | $98,200 | $115,700 |
| 2019 | $4,123 | $204,600 | $93,400 | $111,200 |
| 2018 | $3,974 | $199,400 | $90,800 | $108,600 |
| 2017 | $3,865 | $192,100 | $90,800 | $101,300 |
| 2016 | $3,803 | $191,600 | $90,800 | $100,800 |
| 2015 | $3,610 | $186,300 | $88,200 | $98,100 |
Source: Public Records
Map
Nearby Homes