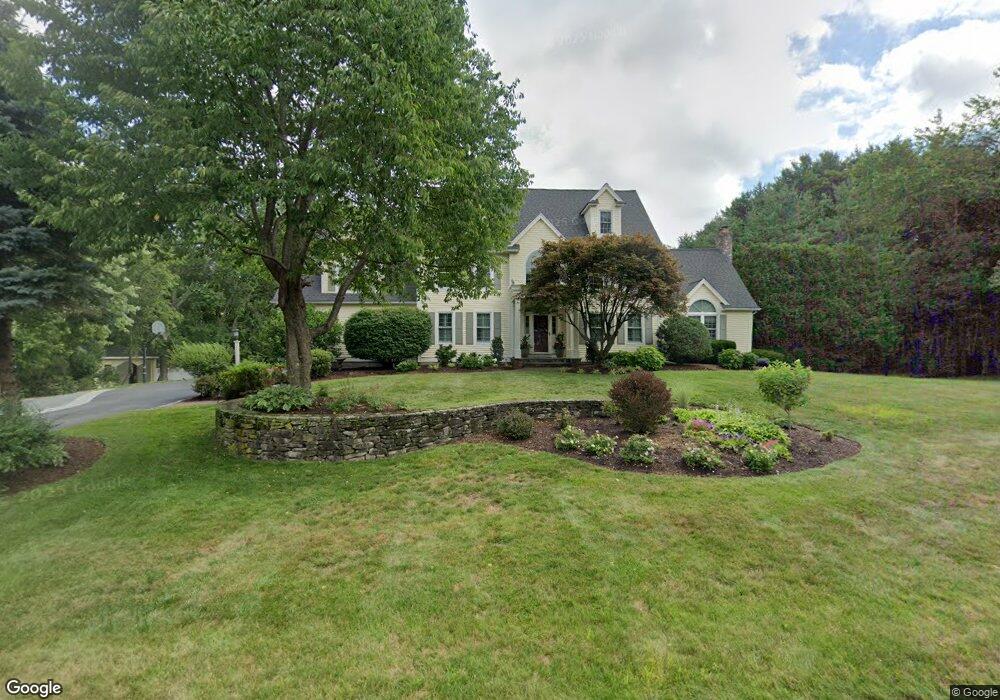
6 Paula Ln Foxboro, MA 02035
Estimated Value: $1,234,525 - $1,389,000
4
Beds
3
Baths
4,113
Sq Ft
$310/Sq Ft
Est. Value
About This Home
This home is located at 6 Paula Ln, Foxboro, MA 02035 and is currently estimated at $1,276,381, approximately $310 per square foot. 6 Paula Ln is a home located in Norfolk County with nearby schools including Foxborough High School, Foxborough Regional Charter School, and Hands-On-Montessori School.
Ownership History
Date
Name
Owned For
Owner Type
Purchase Details
Closed on
Jun 26, 2018
Sold by
Levesque Robert P and Levesque Lisa J
Bought by
Rll Ret
Current Estimated Value
Purchase Details
Closed on
Feb 6, 1996
Sold by
Pride Rt
Bought by
Levesque Lisa J and Levesque Robert P
Home Financials for this Owner
Home Financials are based on the most recent Mortgage that was taken out on this home.
Original Mortgage
$378,000
Interest Rate
7.25%
Mortgage Type
Purchase Money Mortgage
Create a Home Valuation Report for This Property
The Home Valuation Report is an in-depth analysis detailing your home's value as well as a comparison with similar homes in the area
Home Values in the Area
Average Home Value in this Area
Purchase History
| Date | Buyer | Sale Price | Title Company |
|---|---|---|---|
| Rll Ret | -- | -- | |
| Levesque Lisa J | $420,000 | -- |
Source: Public Records
Mortgage History
| Date | Status | Borrower | Loan Amount |
|---|---|---|---|
| Previous Owner | Levesque Lisa J | $417,000 | |
| Previous Owner | Levesque Lisa J | $372,000 | |
| Previous Owner | Levesque Lisa J | $378,000 |
Source: Public Records
Tax History Compared to Growth
Tax History
| Year | Tax Paid | Tax Assessment Tax Assessment Total Assessment is a certain percentage of the fair market value that is determined by local assessors to be the total taxable value of land and additions on the property. | Land | Improvement |
|---|---|---|---|---|
| 2025 | $14,231 | $1,076,500 | $306,700 | $769,800 |
| 2024 | $13,322 | $986,100 | $281,100 | $705,000 |
| 2023 | $12,711 | $894,500 | $268,100 | $626,400 |
| 2022 | $12,269 | $845,000 | $250,800 | $594,200 |
| 2021 | $11,964 | $811,700 | $244,600 | $567,100 |
| 2020 | $11,558 | $793,300 | $244,600 | $548,700 |
| 2019 | $11,387 | $774,600 | $262,700 | $511,900 |
| 2018 | $11,226 | $770,500 | $272,500 | $498,000 |
| 2017 | $10,981 | $730,100 | $264,300 | $465,800 |
| 2016 | $10,899 | $735,400 | $259,800 | $475,600 |
| 2015 | $10,668 | $702,300 | $209,200 | $493,100 |
| 2014 | $10,387 | $692,900 | $209,200 | $483,700 |
Source: Public Records
Map
Nearby Homes
- 406 South St
- 80 Mill St
- 16 Treasure Island Rd
- 450 West St
- 356 Central St
- 12 Spring St
- 483 Thurston St
- 9 Oak Dr
- 24 Maverick Dr
- 277 Central St
- 120 Hawes St
- 166 Chauncy St
- 14 Baker St
- 11 W Belcher Rd Unit 2
- 24 Mechanic St
- 84 Cocasset St Unit A6
- 4 Buckskin Dr
- 18 Winter St Unit E
- 14 Winter St Unit B
- 65 Pond St