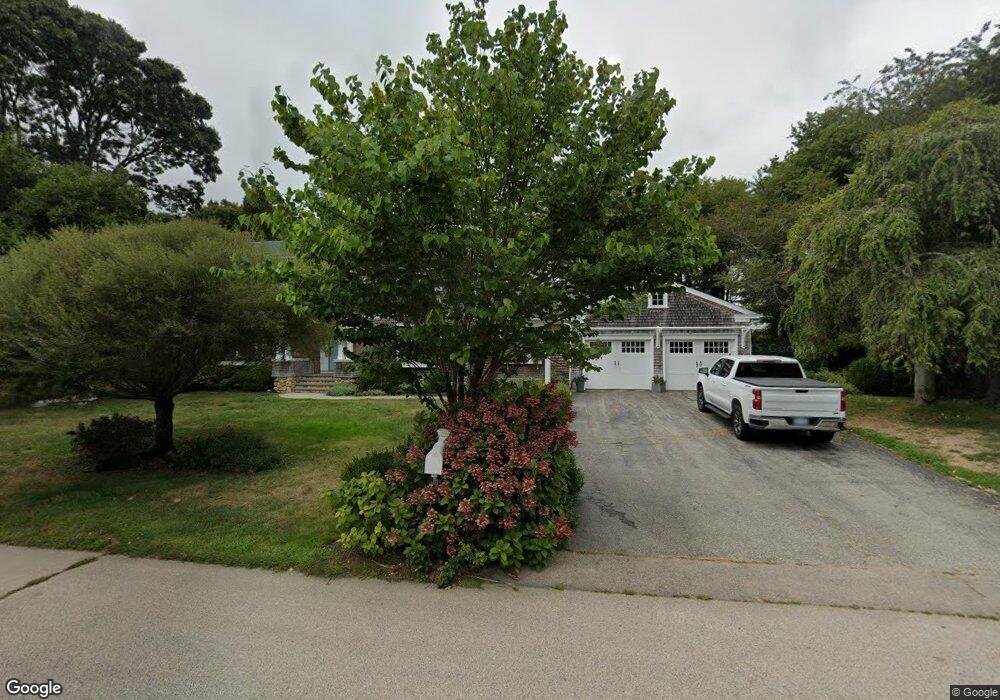
6 Peeptoad Rd Westerly, RI 02891
Estimated Value: $1,276,000 - $1,656,000
4
Beds
3
Baths
2,302
Sq Ft
$636/Sq Ft
Est. Value
About This Home
This home is located at 6 Peeptoad Rd, Westerly, RI 02891 and is currently estimated at $1,463,828, approximately $635 per square foot. 6 Peeptoad Rd is a home located in Washington County with nearby schools including Westerly High School and St. Michael School.
Ownership History
Date
Name
Owned For
Owner Type
Purchase Details
Closed on
Jun 26, 1998
Sold by
Capalbo Robert S and Capalbo Daria G
Bought by
Masterson Elizabeth F and Masterson John B
Current Estimated Value
Home Financials for this Owner
Home Financials are based on the most recent Mortgage that was taken out on this home.
Original Mortgage
$202,500
Interest Rate
7.09%
Create a Home Valuation Report for This Property
The Home Valuation Report is an in-depth analysis detailing your home's value as well as a comparison with similar homes in the area
Home Values in the Area
Average Home Value in this Area
Purchase History
| Date | Buyer | Sale Price | Title Company |
|---|---|---|---|
| Masterson Elizabeth F | $225,000 | -- |
Source: Public Records
Mortgage History
| Date | Status | Borrower | Loan Amount |
|---|---|---|---|
| Open | Masterson Elizabeth F | $302,204 | |
| Closed | Masterson Elizabeth F | $402,500 | |
| Closed | Masterson Elizabeth F | $143,750 | |
| Closed | Masterson Elizabeth F | $202,500 |
Source: Public Records
Tax History
| Year | Tax Paid | Tax Assessment Tax Assessment Total Assessment is a certain percentage of the fair market value that is determined by local assessors to be the total taxable value of land and additions on the property. | Land | Improvement |
|---|---|---|---|---|
| 2025 | $9,243 | $1,300,000 | $616,100 | $683,900 |
| 2024 | $9,399 | $958,100 | $440,700 | $517,400 |
| 2023 | $9,217 | $958,100 | $440,700 | $517,400 |
| 2022 | $9,159 | $958,100 | $440,700 | $517,400 |
| 2021 | $8,505 | $738,300 | $319,400 | $418,900 |
| 2020 | $8,350 | $738,300 | $319,400 | $418,900 |
| 2019 | $8,269 | $738,300 | $319,400 | $418,900 |
| 2018 | $7,786 | $655,400 | $313,600 | $341,800 |
| 2017 | $7,596 | $655,400 | $313,600 | $341,800 |
| 2016 | $7,655 | $655,400 | $313,600 | $341,800 |
| 2015 | $7,254 | $670,400 | $320,100 | $350,300 |
| 2014 | $7,133 | $670,400 | $320,100 | $350,300 |
Source: Public Records
Map
Nearby Homes
- 4 Quail Run
- 4 Shore Rd
- 109 Watch Hill Rd
- 52 Avondale Rd
- 60 Avondale Rd
- 9 Champlin Dr
- 417 River Rd
- 20 Browning Rd
- 10 Tristam St
- 16 Green Ave
- 0 Green Ave
- 27 Benson Ave
- 18 Timothy Dr
- 301 Osbrook Point
- 45 Summertime Cir
- 23 Summertime Cir
- 22 Summertime Cir
- 38 Summertime Cir
- 25 Summertime Cir
- 39 Summertime Cir
- 8 Peeptoad Rd
- 5 Peeptoad Rd
- 2 Peeptoad Rd
- 9 Peeptoad Rd
- 3 Quail Run
- 1 Fox Run
- 129 Watch Hill Rd
- 127 Watch Hill Rd
- 125 Watch Hill Rd
- 131 Watch Hill Rd
- 6 Quail Run
- 133 Watch Hill Rd
- 33 Grassland Way
- 123 Watch Hill Rd
- 121 Watch Hill Rd
- 3 Fox Run
- 6 Fox Run
- 6 Fox Run Run
- 119 Watch Hill Rd
- 136 Watch Hill Rd
Your Personal Tour Guide
Ask me questions while you tour the home.