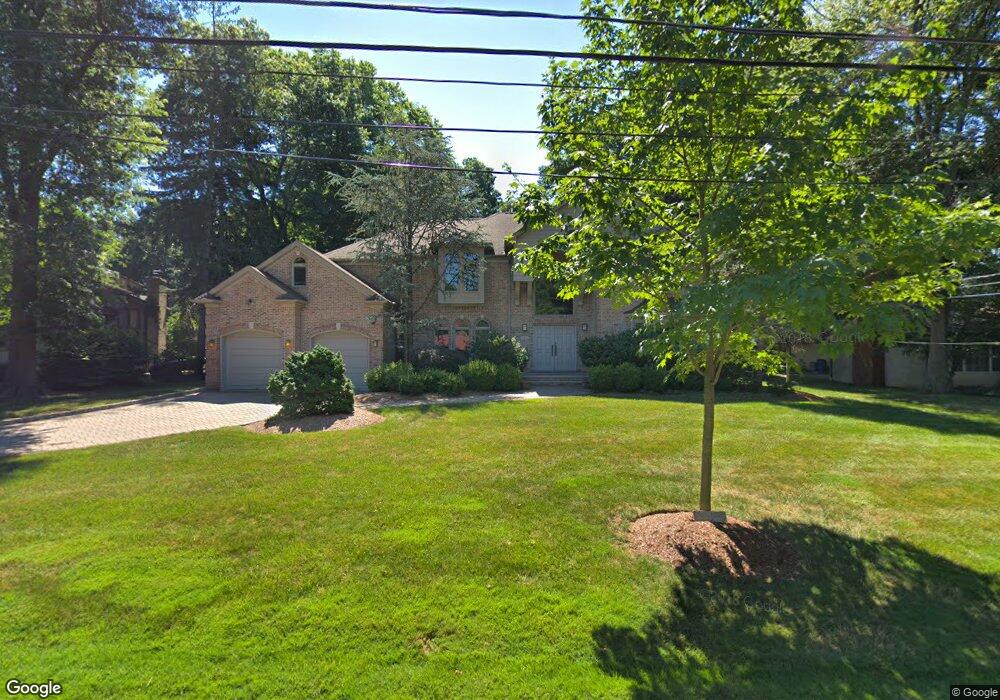
6 Peter Lynas Ct Tenafly, NJ 07670
Estimated Value: $2,733,496 - $3,143,000
--
Bed
--
Bath
4,256
Sq Ft
$695/Sq Ft
Est. Value
About This Home
This home is located at 6 Peter Lynas Ct, Tenafly, NJ 07670 and is currently estimated at $2,958,374, approximately $695 per square foot. 6 Peter Lynas Ct is a home located in Bergen County with nearby schools including Tenafly Middle School, Tenafly High School, and Spring School.
Ownership History
Date
Name
Owned For
Owner Type
Purchase Details
Closed on
Apr 30, 1998
Sold by
Spring Hill Associates Llc
Bought by
Isackson Robert M and Isackson Marla
Current Estimated Value
Purchase Details
Closed on
Aug 18, 1997
Sold by
Kang Tae Yong and Kang Soon Ja
Bought by
Spring Hill Associates Llc
Create a Home Valuation Report for This Property
The Home Valuation Report is an in-depth analysis detailing your home's value as well as a comparison with similar homes in the area
Home Values in the Area
Average Home Value in this Area
Purchase History
| Date | Buyer | Sale Price | Title Company |
|---|---|---|---|
| Isackson Robert M | $885,000 | Chicago Title Insurance Co | |
| Spring Hill Associates Llc | $350,000 | -- |
Source: Public Records
Tax History Compared to Growth
Tax History
| Year | Tax Paid | Tax Assessment Tax Assessment Total Assessment is a certain percentage of the fair market value that is determined by local assessors to be the total taxable value of land and additions on the property. | Land | Improvement |
|---|---|---|---|---|
| 2025 | $44,229 | $1,556,800 | $750,000 | $806,800 |
| 2024 | $43,155 | $1,556,800 | $750,000 | $806,800 |
| 2023 | $42,111 | $1,556,800 | $750,000 | $806,800 |
| 2022 | $42,111 | $1,556,800 | $750,000 | $806,800 |
| 2021 | $41,364 | $1,556,800 | $750,000 | $806,800 |
| 2020 | $40,757 | $1,556,800 | $750,000 | $806,800 |
| 2019 | $40,041 | $1,556,800 | $750,000 | $806,800 |
| 2018 | $39,418 | $1,556,800 | $750,000 | $806,800 |
| 2017 | $39,278 | $1,556,800 | $750,000 | $806,800 |
| 2016 | $38,500 | $1,556,800 | $750,000 | $806,800 |
| 2015 | $37,643 | $1,556,800 | $750,000 | $806,800 |
| 2014 | $36,943 | $1,556,800 | $750,000 | $806,800 |
Source: Public Records
Map
Nearby Homes
- 10 Peter Lynas Ct
- 2 Peter Lynas Ct
- 14 Peter Lynas Ct
- 7 N Brae Ct
- 11 N Brae Ct
- 1 N Brae Ct
- 5 Peter Lynas Ct
- 220 Hudson Ave
- 17 N Brae Ct
- 9 Peter Lynas Ct
- 1 Peter Lynas Ct
- 18 Peter Lynas Ct
- 15 Peter Lynas Ct
- 204 Hudson Ave
- 19 N Brae Ct
- 34 Brook Rd
- 22 Peter Lynas Ct
- 232 Hudson Ave
- 200 Hudson Ave
- 187 Hudson Ave