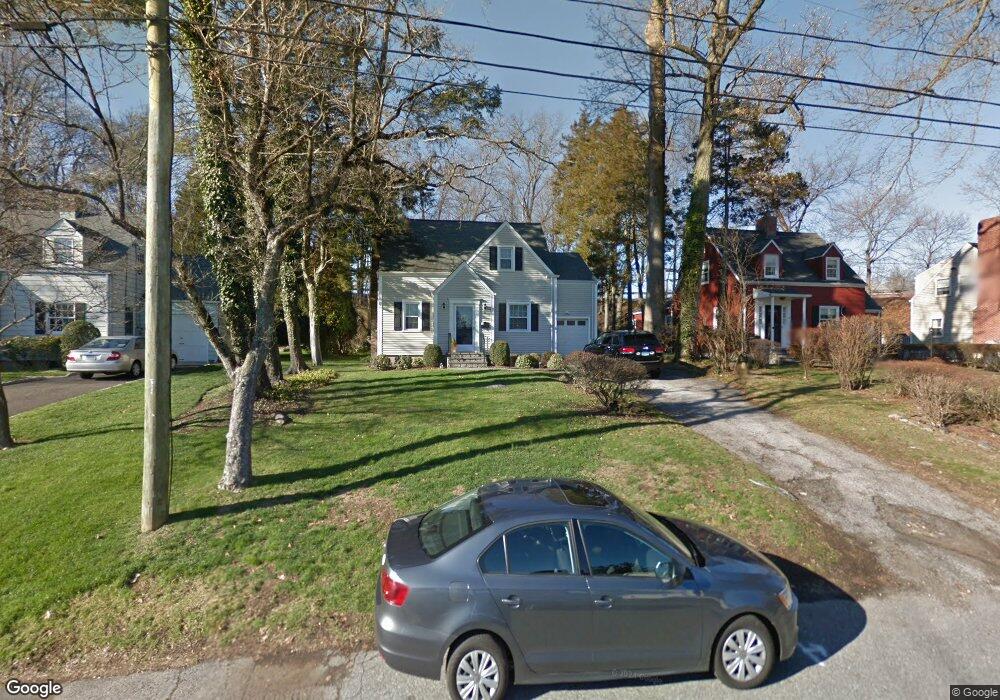
6 Peters Rd Riverside, CT 06878
Estimated Value: $1,221,834 - $2,167,000
3
Beds
1
Bath
1,170
Sq Ft
$1,379/Sq Ft
Est. Value
About This Home
This home is located at 6 Peters Rd, Riverside, CT 06878 and is currently estimated at $1,613,709, approximately $1,379 per square foot. 6 Peters Rd is a home located in Fairfield County with nearby schools including International School At Dundee, Eastern Middle School, and Greenwich High School.
Ownership History
Date
Name
Owned For
Owner Type
Purchase Details
Closed on
May 30, 1996
Sold by
Mcdonald Miles F and Mcdonald Patricia B
Bought by
Dietz John M and Hay-Dietz Margaret
Current Estimated Value
Home Financials for this Owner
Home Financials are based on the most recent Mortgage that was taken out on this home.
Original Mortgage
$220,000
Outstanding Balance
$12,797
Interest Rate
7%
Mortgage Type
Unknown
Estimated Equity
$1,600,912
Create a Home Valuation Report for This Property
The Home Valuation Report is an in-depth analysis detailing your home's value as well as a comparison with similar homes in the area
Home Values in the Area
Average Home Value in this Area
Purchase History
| Date | Buyer | Sale Price | Title Company |
|---|---|---|---|
| Dietz John M | $292,000 | -- |
Source: Public Records
Mortgage History
| Date | Status | Borrower | Loan Amount |
|---|---|---|---|
| Closed | Dietz John M | $137,000 | |
| Open | Dietz John M | $220,000 |
Source: Public Records
Tax History Compared to Growth
Tax History
| Year | Tax Paid | Tax Assessment Tax Assessment Total Assessment is a certain percentage of the fair market value that is determined by local assessors to be the total taxable value of land and additions on the property. | Land | Improvement |
|---|---|---|---|---|
| 2025 | $6,867 | $555,590 | $505,610 | $49,980 |
| 2024 | $6,632 | $555,590 | $505,610 | $49,980 |
| 2023 | $6,465 | $555,590 | $505,610 | $49,980 |
| 2022 | $6,406 | $555,590 | $505,610 | $49,980 |
| 2021 | $5,976 | $496,370 | $437,570 | $58,800 |
| 2020 | $5,966 | $496,370 | $437,570 | $58,800 |
| 2019 | $6,026 | $496,370 | $437,570 | $58,800 |
| 2018 | $5,892 | $496,370 | $437,570 | $58,800 |
| 2017 | $5,966 | $496,370 | $437,570 | $58,800 |
| 2016 | $5,872 | $496,370 | $437,570 | $58,800 |
| 2015 | $5,721 | $479,780 | $432,110 | $47,670 |
| 2014 | $5,577 | $479,780 | $432,110 | $47,670 |
Source: Public Records
Map
Nearby Homes
- 27 Sound Beach Ave
- 18 Sound Beach Ave
- 143 Lockwood Rd
- 20 Center Dr
- 25 Dialstone Ln
- 25 Hoover Rd
- 6 Dorchester Ln
- 23 Silver Beech Rd
- 1465 E Putnam Ave Unit 525
- 11 Perna Ln
- 45 Sunshine Ave
- 48 Meyer Place
- 119 Hendrie Ave
- 32 Meyer Place
- 3 Finney Knoll Ln
- 51 Forest Ave Unit 98
- 51 Forest Ave Unit 82
- 33 Halsey Dr
- 22 Summit Rd
- 7 Highview Ave