Estimated Value: $2,169,557 - $3,260,000
4
Beds
4
Baths
5,986
Sq Ft
$422/Sq Ft
Est. Value
About This Home
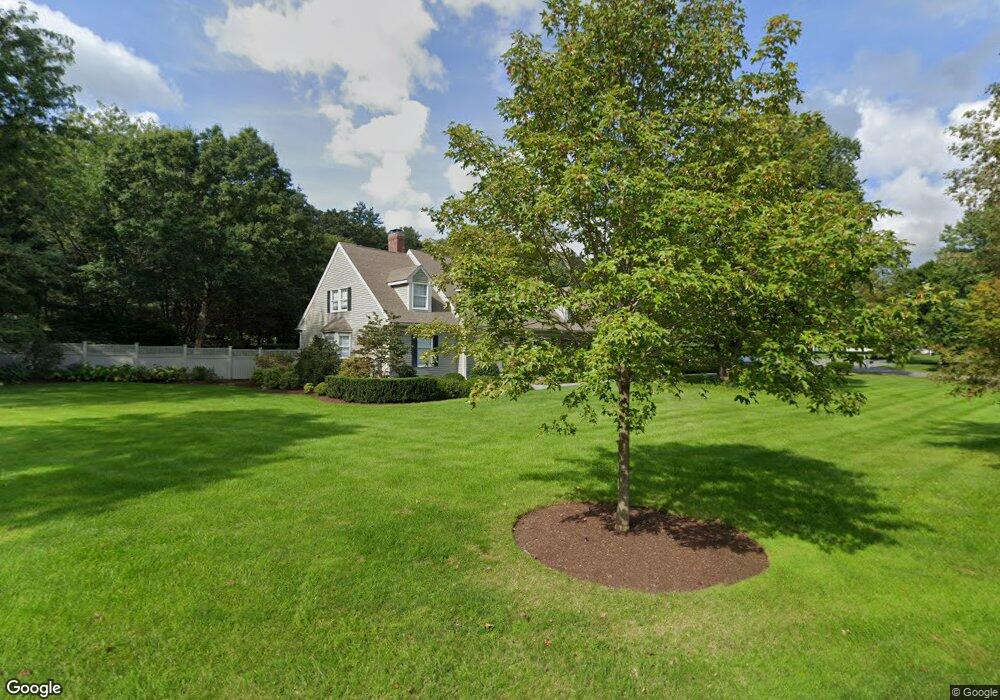
This home is located at 6 Phillips Ln, Dover, MA 02030 and is currently estimated at $2,527,389, approximately $422 per square foot. 6 Phillips Ln is a home located in Norfolk County with nearby schools including Chickering Elementary School, Dover-Sherborn Regional Middle School, and Dover-Sherborn Regional High School.
Ownership History
Date
Name
Owned For
Owner Type
Purchase Details
Closed on
Aug 28, 1996
Sold by
Snyder Ft
Bought by
Bono Marguerite B
Current Estimated Value
Home Financials for this Owner
Home Financials are based on the most recent Mortgage that was taken out on this home.
Original Mortgage
$608,000
Outstanding Balance
$52,116
Interest Rate
8.18%
Mortgage Type
Purchase Money Mortgage
Estimated Equity
$2,475,273
Purchase Details
Closed on
Nov 16, 1988
Sold by
Springdale Farms Lp
Bought by
Chalas Bruce
Create a Home Valuation Report for This Property
The Home Valuation Report is an in-depth analysis detailing your home's value as well as a comparison with similar homes in the area
Home Values in the Area
Average Home Value in this Area
Purchase History
| Date | Buyer | Sale Price | Title Company |
|---|---|---|---|
| Bono Marguerite B | $760,000 | -- | |
| Chalas Bruce | $624,200 | -- |
Source: Public Records
Mortgage History
| Date | Status | Borrower | Loan Amount |
|---|---|---|---|
| Open | Chalas Bruce | $608,000 | |
| Previous Owner | Chalas Bruce | $50,000 | |
| Previous Owner | Chalas Bruce | $393,600 |
Source: Public Records
Tax History
| Year | Tax Paid | Tax Assessment Tax Assessment Total Assessment is a certain percentage of the fair market value that is determined by local assessors to be the total taxable value of land and additions on the property. | Land | Improvement |
|---|---|---|---|---|
| 2025 | $20,784 | $1,844,200 | $712,000 | $1,132,200 |
| 2024 | $20,093 | $1,833,300 | $701,100 | $1,132,200 |
| 2023 | $19,711 | $1,617,000 | $635,300 | $981,700 |
| 2022 | $19,099 | $1,537,800 | $635,300 | $902,500 |
| 2021 | $19,822 | $1,537,800 | $635,300 | $902,500 |
| 2020 | $19,745 | $1,537,800 | $635,300 | $902,500 |
| 2019 | $19,864 | $1,536,300 | $635,300 | $901,000 |
| 2018 | $18,316 | $1,426,500 | $580,900 | $845,600 |
| 2017 | $17,999 | $1,379,200 | $602,700 | $776,500 |
| 2016 | $17,787 | $1,381,000 | $602,700 | $778,300 |
| 2015 | $17,652 | $1,389,900 | $615,700 | $774,200 |
Source: Public Records
Map
Nearby Homes
Your Personal Tour Guide
Ask me questions while you tour the home.