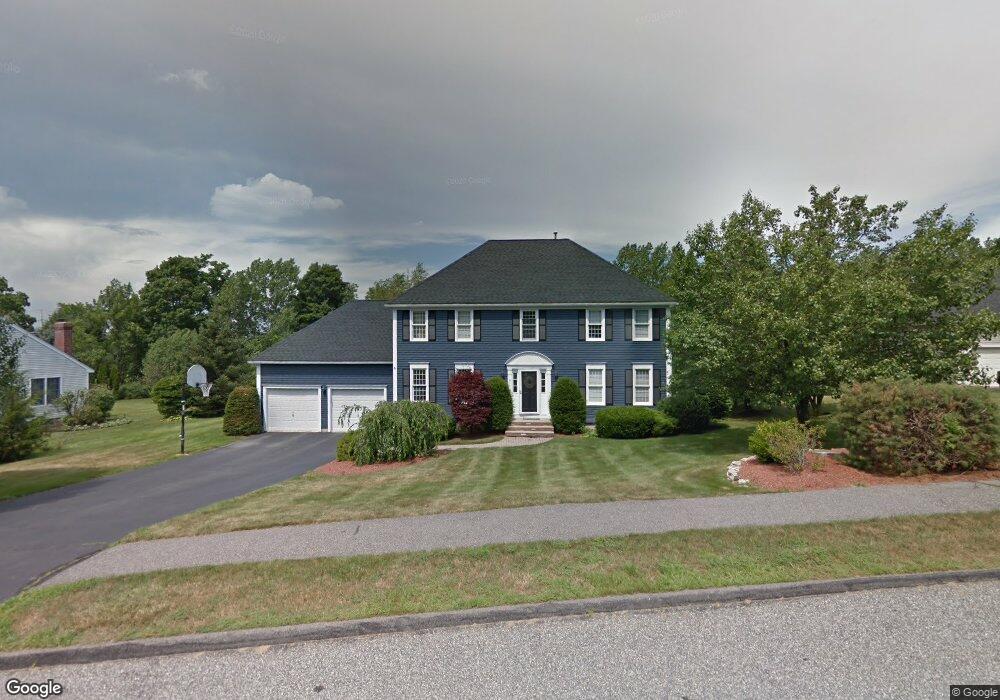
6 Piccadilly Way Westborough, MA 01581
Estimated Value: $1,014,000 - $1,129,000
4
Beds
3
Baths
2,512
Sq Ft
$428/Sq Ft
Est. Value
About This Home
This home is located at 6 Piccadilly Way, Westborough, MA 01581 and is currently estimated at $1,074,978, approximately $427 per square foot. 6 Piccadilly Way is a home located in Worcester County with nearby schools including Westborough High School, Ebridge Montessori School, and Westboro Knowledge Beginnings.
Ownership History
Date
Name
Owned For
Owner Type
Purchase Details
Closed on
May 26, 2005
Sold by
Rohatgi Manisha W
Bought by
Dumont Andrea J and Badger Michael D
Current Estimated Value
Home Financials for this Owner
Home Financials are based on the most recent Mortgage that was taken out on this home.
Original Mortgage
$492,400
Outstanding Balance
$260,034
Interest Rate
5.94%
Mortgage Type
Purchase Money Mortgage
Estimated Equity
$814,944
Purchase Details
Closed on
Mar 23, 1999
Sold by
Siegel Scott A and Siegel Sandra H
Bought by
Rohatgi Manisha W and Rohatgi Rajeev
Home Financials for this Owner
Home Financials are based on the most recent Mortgage that was taken out on this home.
Original Mortgage
$270,000
Interest Rate
6.74%
Mortgage Type
Purchase Money Mortgage
Purchase Details
Closed on
Jan 14, 1994
Sold by
Carruth Capital Corp
Bought by
Siegel Scott and Siegel Sandra
Create a Home Valuation Report for This Property
The Home Valuation Report is an in-depth analysis detailing your home's value as well as a comparison with similar homes in the area
Home Values in the Area
Average Home Value in this Area
Purchase History
| Date | Buyer | Sale Price | Title Company |
|---|---|---|---|
| Dumont Andrea J | $622,000 | -- | |
| Rohatgi Manisha W | $366,875 | -- | |
| Siegel Scott | $291,452 | -- |
Source: Public Records
Mortgage History
| Date | Status | Borrower | Loan Amount |
|---|---|---|---|
| Open | Dumont Andrea J | $492,400 | |
| Previous Owner | Siegel Scott | $213,500 | |
| Previous Owner | Siegel Scott | $73,900 | |
| Previous Owner | Siegel Scott | $270,000 |
Source: Public Records
Tax History Compared to Growth
Tax History
| Year | Tax Paid | Tax Assessment Tax Assessment Total Assessment is a certain percentage of the fair market value that is determined by local assessors to be the total taxable value of land and additions on the property. | Land | Improvement |
|---|---|---|---|---|
| 2025 | $14,203 | $871,900 | $361,300 | $510,600 |
| 2024 | $13,740 | $837,300 | $343,800 | $493,500 |
| 2023 | $13,002 | $772,100 | $324,300 | $447,800 |
| 2022 | $12,059 | $652,200 | $258,400 | $393,800 |
| 2021 | $5,287 | $641,800 | $248,000 | $393,800 |
| 2020 | $4,461 | $646,700 | $262,400 | $384,300 |
| 2019 | $4,026 | $630,700 | $258,300 | $372,400 |
| 2018 | $3,087 | $581,000 | $248,000 | $333,000 |
| 2017 | $10,342 | $581,000 | $248,000 | $333,000 |
| 2016 | $10,381 | $584,200 | $248,000 | $336,200 |
| 2015 | $9,871 | $531,000 | $219,000 | $312,000 |
Source: Public Records
Map
Nearby Homes
- 4 Upton Rd
- 39 Warren St
- 56 Ruggles St
- 15 Beach St
- 75 South St
- 21 South St Unit 31
- 7 Jennings Rd
- 14 Grove St Unit 2
- 27 Spring Rd
- 2 Spring Ln
- 68 Spring St
- 57 Spring Rd
- 6 Folly Ln
- 135 Fruit St
- 43 Church St
- 23 Water St
- 192 W Main St
- 48 High Street Extension
- 4403 Peters Farm Way Unit 403
- 5 Blossom Ct Unit 5
- 8 Piccadilly Way
- 4 Piccadilly Way
- 10 Piccadilly Way
- 2 Piccadilly Way
- 18 Morse St
- 9 Piccadilly Way
- 12 Piccadilly Way
- 16 Morse St
- 0 Piccadilly Way Unit 72300251
- 7 Piccadilly Way
- 11 Piccadilly Way
- 5 Piccadilly Way
- 22 Morse St
- 15 Piccadilly Way
- 14 Piccadilly Way
- 3 Piccadilly Way
- 14 Morse St
- 17 Piccadilly Way
- 16 Piccadilly Way
- 12 Morse St