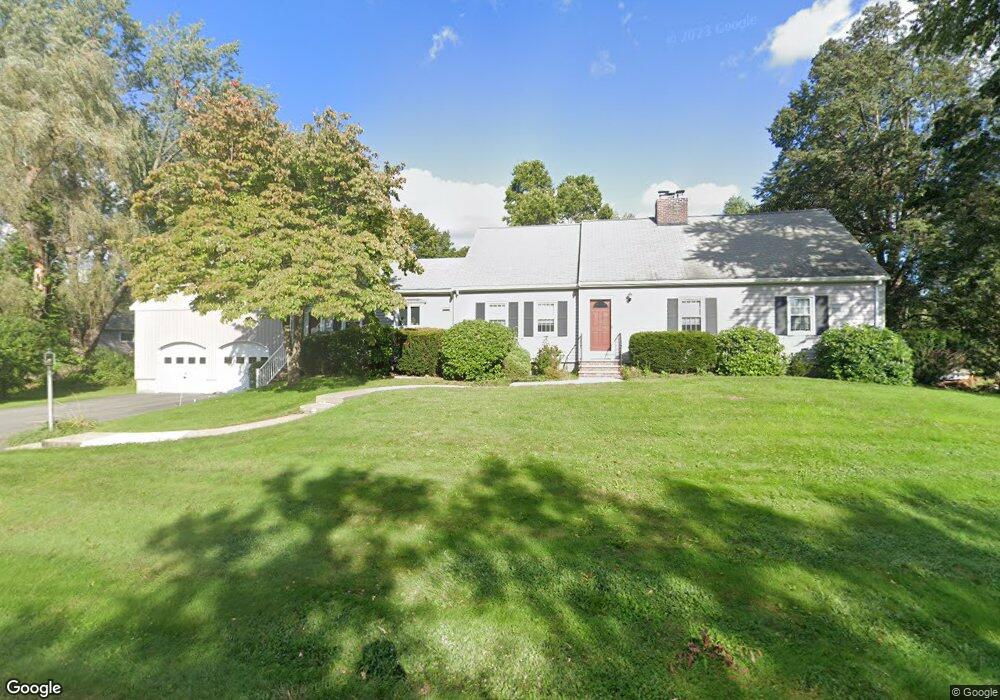
6 Pinecrest Rd Andover, MA 01810
Estimated Value: $977,975 - $1,214,000
4
Beds
2
Baths
3,137
Sq Ft
$358/Sq Ft
Est. Value
About This Home
This home is located at 6 Pinecrest Rd, Andover, MA 01810 and is currently estimated at $1,122,494, approximately $357 per square foot. 6 Pinecrest Rd is a home located in Essex County with nearby schools including South Elementary School, Doherty Middle School, and Andover High School.
Ownership History
Date
Name
Owned For
Owner Type
Purchase Details
Closed on
Feb 24, 2016
Sold by
Wager Geoffrey E and Wager Gloria S
Bought by
Wager Rt and Wager
Current Estimated Value
Purchase Details
Closed on
Sep 26, 1975
Bought by
Wager Rt
Create a Home Valuation Report for This Property
The Home Valuation Report is an in-depth analysis detailing your home's value as well as a comparison with similar homes in the area
Purchase History
| Date | Buyer | Sale Price | Title Company |
|---|---|---|---|
| Wager Rt | -- | -- | |
| Wager Rt | -- | -- | |
| Wager Rt | $63,000 | -- |
Source: Public Records
Mortgage History
| Date | Status | Borrower | Loan Amount |
|---|---|---|---|
| Previous Owner | Wager Rt | $30,000 | |
| Previous Owner | Wager Rt | $100,000 | |
| Previous Owner | Wager Rt | $25,000 |
Source: Public Records
Tax History
| Year | Tax Paid | Tax Assessment Tax Assessment Total Assessment is a certain percentage of the fair market value that is determined by local assessors to be the total taxable value of land and additions on the property. | Land | Improvement |
|---|---|---|---|---|
| 2024 | $10,766 | $835,900 | $382,700 | $453,200 |
| 2023 | $9,789 | $716,600 | $344,800 | $371,800 |
| 2022 | $9,383 | $642,700 | $299,800 | $342,900 |
| 2021 | $8,977 | $587,100 | $272,400 | $314,700 |
| 2020 | $8,607 | $573,400 | $265,600 | $307,800 |
| 2019 | $8,511 | $557,400 | $257,700 | $299,700 |
| 2018 | $8,186 | $523,400 | $248,000 | $275,400 |
| 2017 | $7,326 | $482,600 | $243,100 | $239,500 |
| 2016 | $7,152 | $482,600 | $243,100 | $239,500 |
| 2015 | $6,877 | $459,400 | $233,700 | $225,700 |
Source: Public Records
Map
Nearby Homes
- 344 S Main St
- 56 Sunset Rock Rd
- 11 Wyncrest Cir
- 3 West Hollow
- 133B Salem
- 4 Hammond Way
- 16 Porter Rd
- 31 Porter Rd
- 104 Salem St
- 57 Salem St
- 47 Harold Parker Rd
- 52 Salem St
- 5 Colonial Dr Unit B5-6
- 18 Dale St Unit 9D
- 154 Main St
- 11 Cogswell Rd
- 3 Torr St
- 1 Delisio Dr
- 105 Central St
- 12 B Chester Rd Unit D
Your Personal Tour Guide
Ask me questions while you tour the home.