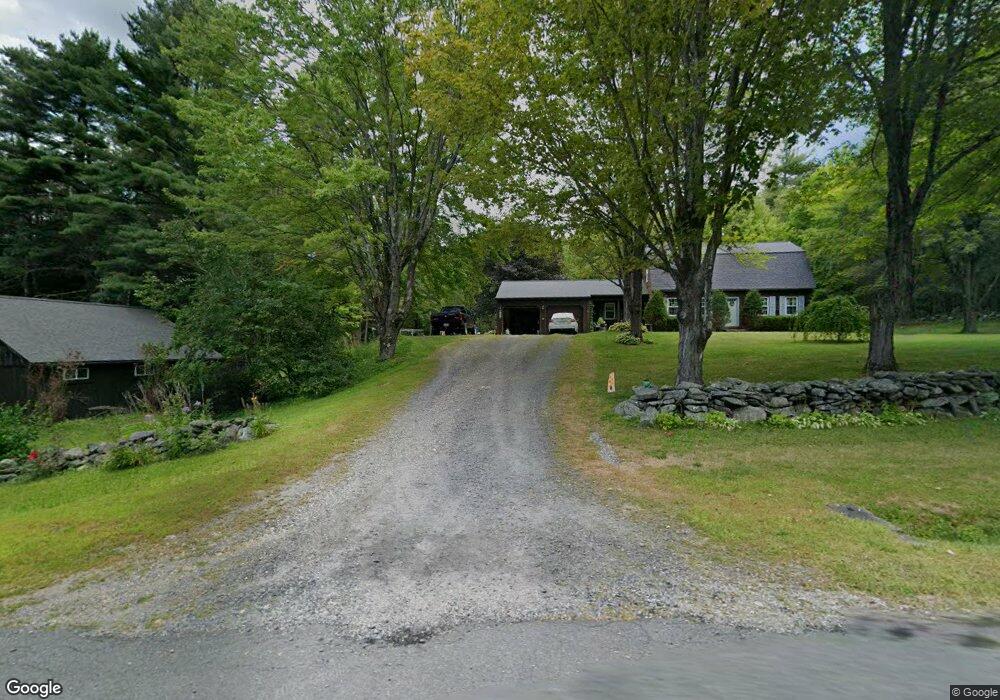
6 Potash Hill Extension Cummington, MA 01026
Estimated Value: $430,738 - $476,000
3
Beds
2
Baths
1,948
Sq Ft
$229/Sq Ft
Est. Value
About This Home
This home is located at 6 Potash Hill Extension, Cummington, MA 01026 and is currently estimated at $446,435, approximately $229 per square foot. 6 Potash Hill Extension is a home located in Hampshire County with nearby schools including Wahconah Regional High School.
Ownership History
Date
Name
Owned For
Owner Type
Purchase Details
Closed on
Nov 4, 2022
Sold by
Vandoloski Raymond L
Bought by
Michaelenko Emily E and Howes Troy B
Current Estimated Value
Home Financials for this Owner
Home Financials are based on the most recent Mortgage that was taken out on this home.
Original Mortgage
$308,000
Outstanding Balance
$297,355
Interest Rate
6.7%
Mortgage Type
Purchase Money Mortgage
Estimated Equity
$149,080
Purchase Details
Closed on
Oct 25, 2022
Sold by
Vandoloski Monica M Est and Vandoloski
Bought by
Vandoloski Raymond L
Home Financials for this Owner
Home Financials are based on the most recent Mortgage that was taken out on this home.
Original Mortgage
$308,000
Outstanding Balance
$297,355
Interest Rate
6.7%
Mortgage Type
Purchase Money Mortgage
Estimated Equity
$149,080
Create a Home Valuation Report for This Property
The Home Valuation Report is an in-depth analysis detailing your home's value as well as a comparison with similar homes in the area
Home Values in the Area
Average Home Value in this Area
Purchase History
| Date | Buyer | Sale Price | Title Company |
|---|---|---|---|
| Michaelenko Emily E | $385,000 | None Available | |
| Vandoloski Raymond L | -- | None Available | |
| Vandoloski Raymond L | -- | None Available |
Source: Public Records
Mortgage History
| Date | Status | Borrower | Loan Amount |
|---|---|---|---|
| Open | Michaelenko Emily E | $308,000 |
Source: Public Records
Tax History Compared to Growth
Tax History
| Year | Tax Paid | Tax Assessment Tax Assessment Total Assessment is a certain percentage of the fair market value that is determined by local assessors to be the total taxable value of land and additions on the property. | Land | Improvement |
|---|---|---|---|---|
| 2025 | $4,428 | $347,000 | $49,600 | $297,400 |
| 2024 | $3,930 | $291,100 | $44,800 | $246,300 |
| 2023 | $4,093 | $291,100 | $44,800 | $246,300 |
| 2022 | $3,945 | $273,000 | $41,000 | $232,000 |
| 2021 | $3,868 | $253,800 | $41,000 | $212,800 |
| 2020 | $3,728 | $253,800 | $41,000 | $212,800 |
| 2019 | $3,665 | $253,800 | $41,000 | $212,800 |
| 2018 | $3,565 | $250,200 | $37,400 | $212,800 |
| 2017 | $3,302 | $236,200 | $38,200 | $198,000 |
| 2016 | $3,205 | $236,900 | $52,600 | $184,300 |
| 2015 | $3,073 | $236,900 | $52,600 | $184,300 |
Source: Public Records
Map
Nearby Homes
- 54 Porter Hill Rd
- 10 Maple St
- 237 Trouble St
- 23 E Windsor Rd
- 90 Williamsburg Rd
- 458 Old Rd N
- 333 Ranney Corner Rd
- 19 Buffington Hill Rd
- 1689 E Windsor Rd
- 00 Yale Rd
- 29 Union St
- 0 Spruce Corner Rd Unit 73244975
- 138 Ridge Rd
- 0 John Ford Rd Unit 73403157
- 0 John Ford Rd Unit 73403156
- LOT 1 Thayer Hill Rd
- lot 16 Pierce Rd
- lot 18 Pierce Rd
- lot 19 Pierce Rd
- lot 17 Pierce Rd
- 6 Potash Hill Extension
- 7 Potash Hill Extension
- 72 Potash Hill Rd
- LOT 2 Potash Hill Rd
- 73 Potash Hill Rd
- 50 Potash Hill Rd
- 5 Frazier Ln
- 26-4-0 Cole St
- 48 Potash Hill Rd
- 47 Potash Hill Rd
- 9 Frazier Ln
- 130 Bryant Rd
- 87 Potash Hill Rd
- 35 Potash Hill Rd
- 110 West St
- 112 West St
- 73 West St
- 185 West St
- 13 West St
- 111 West St