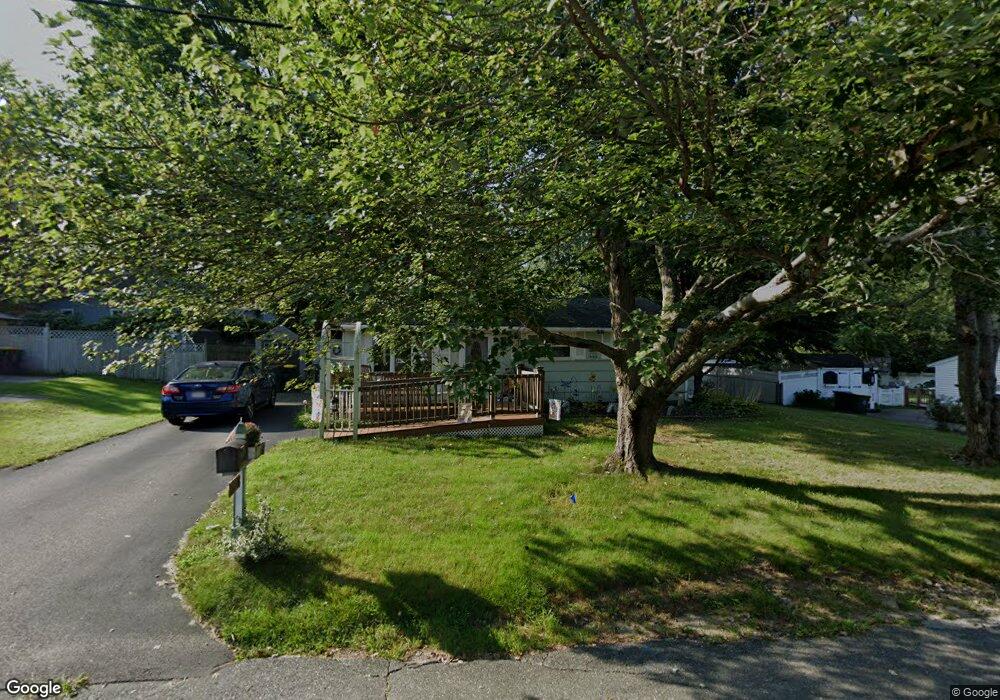
6 Potter Dr Bellingham, MA 02019
Estimated Value: $387,000 - $423,096
3
Beds
1
Bath
912
Sq Ft
$453/Sq Ft
Est. Value
About This Home
This home is located at 6 Potter Dr, Bellingham, MA 02019 and is currently estimated at $413,274, approximately $453 per square foot. 6 Potter Dr is a home located in Norfolk County with nearby schools including Stall Brook Elementary School, Bellingham High School, and Bethany Christian Academy.
Ownership History
Date
Name
Owned For
Owner Type
Purchase Details
Closed on
Nov 13, 2017
Sold by
Braley Edward H and Braley Mary P
Bought by
Braley Joanne B
Current Estimated Value
Purchase Details
Closed on
Aug 1, 1969
Bought by
Braley Edward and Braley Mary
Create a Home Valuation Report for This Property
The Home Valuation Report is an in-depth analysis detailing your home's value as well as a comparison with similar homes in the area
Home Values in the Area
Average Home Value in this Area
Purchase History
| Date | Buyer | Sale Price | Title Company |
|---|---|---|---|
| Braley Joanne B | -- | -- | |
| Braley Edward | $13,900 | -- |
Source: Public Records
Mortgage History
| Date | Status | Borrower | Loan Amount |
|---|---|---|---|
| Previous Owner | Braley Edward | $50,000 |
Source: Public Records
Tax History
| Year | Tax Paid | Tax Assessment Tax Assessment Total Assessment is a certain percentage of the fair market value that is determined by local assessors to be the total taxable value of land and additions on the property. | Land | Improvement |
|---|---|---|---|---|
| 2025 | $4,203 | $334,600 | $164,800 | $169,800 |
| 2024 | $3,855 | $299,800 | $150,500 | $149,300 |
| 2023 | $3,718 | $284,900 | $143,300 | $141,600 |
| 2022 | $3,564 | $253,100 | $119,500 | $133,600 |
| 2021 | $3,479 | $241,400 | $119,500 | $121,900 |
| 2020 | $3,254 | $228,800 | $119,500 | $109,300 |
| 2019 | $3,186 | $224,200 | $119,500 | $104,700 |
| 2018 | $2,930 | $203,300 | $114,900 | $88,400 |
| 2017 | $2,874 | $200,400 | $114,900 | $85,500 |
| 2016 | $2,749 | $192,400 | $113,000 | $79,400 |
| 2015 | $2,636 | $185,000 | $108,600 | $76,400 |
| 2014 | $2,643 | $180,300 | $106,100 | $74,200 |
Source: Public Records
Map
Nearby Homes
- 34 Bellwood Cir Unit 34
- 1 Evergreen Dr Unit 1
- 125 Blackstone St
- 67 Blackstone St
- 23 Bellwood Cir Unit 23
- 7 Palmetto Dr Unit 7
- 123-125 Mendon St
- 3003 Maple Brook Rd Unit 3003
- 1501 Old Bridge Ln Unit 1501
- 1303 Old Bridge Ln Unit 1303
- 1 Whitman Cir Unit 1
- 3 Whitman Cir Unit 3
- 5 Whitman Cir Unit 5
- 58 Douglas Dr
- 19 Geordan Ave
- 0 North St Unit 73440626
- 6 Barrows Rd
- 48 Donna Rd
- 95 Lisa Ann Dr
- 60 Wethersfield Rd
Your Personal Tour Guide
Ask me questions while you tour the home.