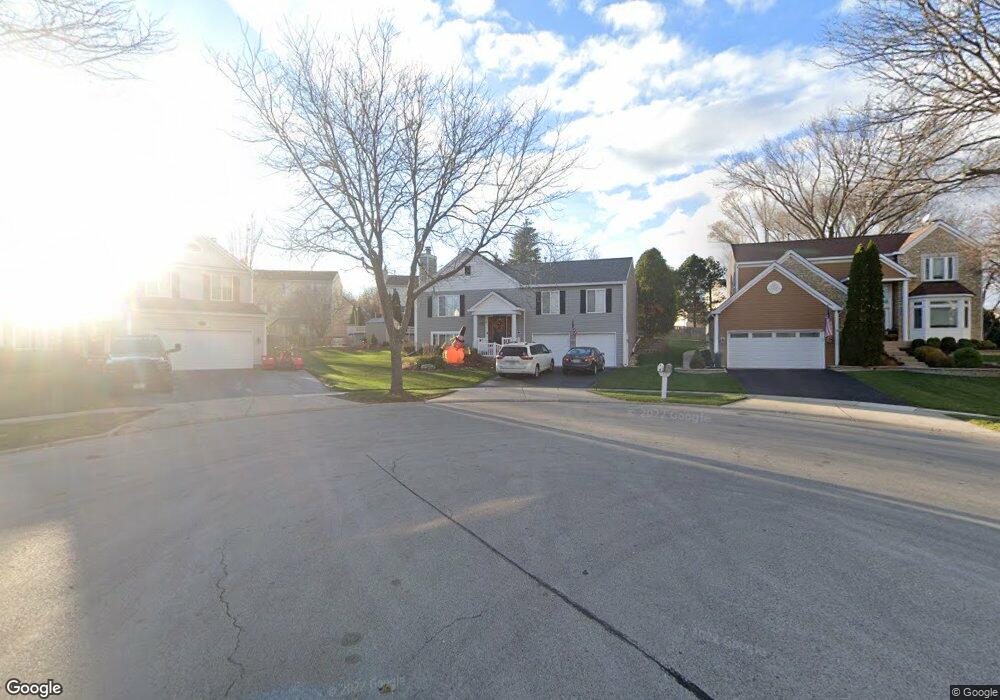
6 Preston Ct Algonquin, IL 60102
Estimated Value: $394,000 - $453,000
3
Beds
3
Baths
2,742
Sq Ft
$156/Sq Ft
Est. Value
About This Home
This home is located at 6 Preston Ct, Algonquin, IL 60102 and is currently estimated at $427,898, approximately $156 per square foot. 6 Preston Ct is a home located in McHenry County with nearby schools including Westfield Community School, Lincoln Prairie Elementary School, and Harry D Jacobs High School.
Ownership History
Date
Name
Owned For
Owner Type
Purchase Details
Closed on
Jun 12, 2017
Sold by
Stallard David M and Stallard Gina M
Bought by
Tipton James B and Tipton Denise M
Current Estimated Value
Home Financials for this Owner
Home Financials are based on the most recent Mortgage that was taken out on this home.
Original Mortgage
$196,000
Outstanding Balance
$163,165
Interest Rate
4.05%
Mortgage Type
New Conventional
Estimated Equity
$264,733
Purchase Details
Closed on
Jan 29, 2002
Sold by
Pulte Homes
Bought by
Kozubal Joseph C and Kozubal Virginia M
Home Financials for this Owner
Home Financials are based on the most recent Mortgage that was taken out on this home.
Original Mortgage
$160,750
Interest Rate
7.26%
Purchase Details
Closed on
May 26, 1995
Sold by
Pulte Home Corp
Bought by
Stallard David M and Stallard Gina M
Home Financials for this Owner
Home Financials are based on the most recent Mortgage that was taken out on this home.
Original Mortgage
$148,350
Interest Rate
8.26%
Mortgage Type
FHA
Create a Home Valuation Report for This Property
The Home Valuation Report is an in-depth analysis detailing your home's value as well as a comparison with similar homes in the area
Purchase History
| Date | Buyer | Sale Price | Title Company |
|---|---|---|---|
| Tipton James B | $245,000 | First American Title Ins Co | |
| Kozubal Joseph C | $215,398 | 1St American Title | |
| Stallard David M | $159,500 | -- |
Source: Public Records
Mortgage History
| Date | Status | Borrower | Loan Amount |
|---|---|---|---|
| Open | Tipton James B | $196,000 | |
| Previous Owner | Kozubal Joseph C | $160,750 | |
| Previous Owner | Stallard David M | $148,350 |
Source: Public Records
Tax History
| Year | Tax Paid | Tax Assessment Tax Assessment Total Assessment is a certain percentage of the fair market value that is determined by local assessors to be the total taxable value of land and additions on the property. | Land | Improvement |
|---|---|---|---|---|
| 2024 | $8,532 | $117,066 | $27,938 | $89,128 |
| 2023 | $8,095 | $104,701 | $24,987 | $79,714 |
| 2022 | $7,465 | $93,043 | $29,800 | $63,243 |
| 2021 | $7,159 | $86,680 | $27,762 | $58,918 |
| 2020 | $6,969 | $83,611 | $26,779 | $56,832 |
| 2019 | $6,797 | $80,026 | $25,631 | $54,395 |
| 2018 | $6,475 | $73,927 | $23,678 | $50,249 |
| 2017 | $6,338 | $69,644 | $22,306 | $47,338 |
| 2016 | $6,238 | $65,320 | $20,921 | $44,399 |
| 2013 | -- | $61,525 | $19,517 | $42,008 |
Source: Public Records
Map
Nearby Homes
- 145 S Oakleaf Rd
- 7 Falcon Ridge Ct
- 135 Arquilla Dr
- 14 Wander Way
- 1920 Jester Ln
- 1431 Essex St
- 113 Pheasant Trail
- 101 Oakleaf Rd
- 119 Lake Dr
- 1354 Essex St Unit 2
- LOT 3 Blackhawk Dr
- 700 Fairfield Ln
- 13 Brian Ct
- 681 Majestic Dr
- 909 Roger St
- 338 Hiawatha Dr
- 760 Regal Ln
- 298 Apache Trail
- 1820 Crofton Dr
- 521 Pawnee Dr
Your Personal Tour Guide
Ask me questions while you tour the home.