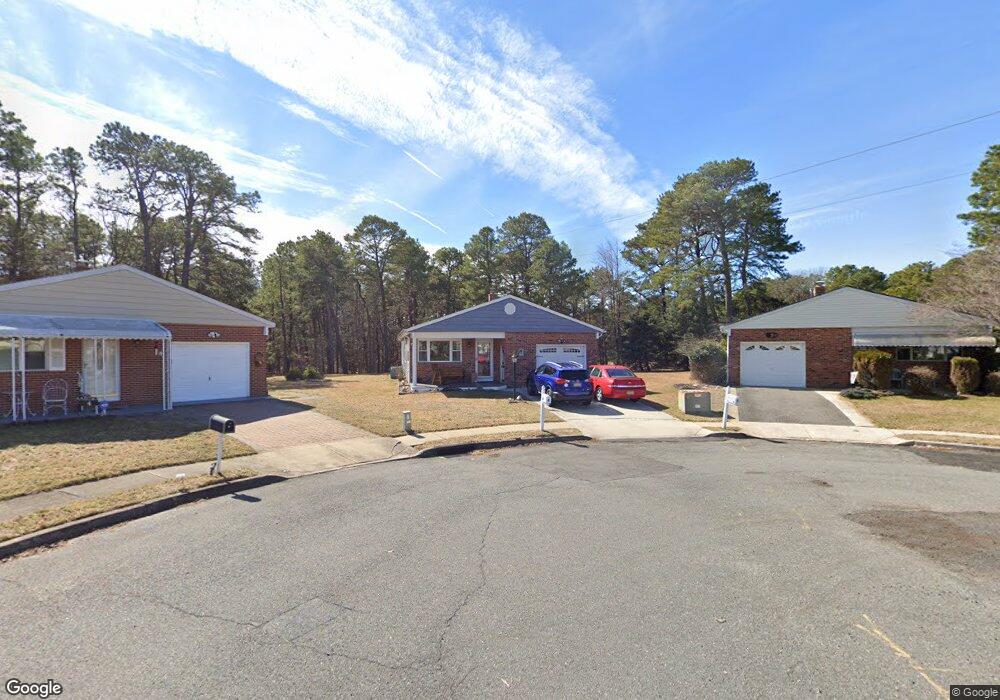
6 Preston Ct Toms River, NJ 08757
Estimated Value: $322,000 - $410,000
2
Beds
2
Baths
1,232
Sq Ft
$294/Sq Ft
Est. Value
About This Home
This home is located at 6 Preston Ct, Toms River, NJ 08757 and is currently estimated at $361,641, approximately $293 per square foot. 6 Preston Ct is a home located in Ocean County with nearby schools including Central Regional Middle School, Central Regional High School, and Ambassador Christian Academy.
Ownership History
Date
Name
Owned For
Owner Type
Purchase Details
Closed on
Dec 30, 2020
Sold by
Peterson Craig A and Peterson Barbara
Bought by
Skupski Walter and Malone Janice
Current Estimated Value
Purchase Details
Closed on
Dec 18, 2020
Sold by
Peterson Craig A and Peterson Barbara
Bought by
Skupski Walter and Malone Janice
Purchase Details
Closed on
Mar 30, 2010
Sold by
Griffin Marion and Pontier Ruth
Bought by
Peterson Craig A and Peterson Barbara
Home Financials for this Owner
Home Financials are based on the most recent Mortgage that was taken out on this home.
Original Mortgage
$71,250
Interest Rate
5.12%
Mortgage Type
New Conventional
Purchase Details
Closed on
Feb 8, 2007
Sold by
Griffin Marion and Verilhac Paul
Bought by
Griffin Marion
Create a Home Valuation Report for This Property
The Home Valuation Report is an in-depth analysis detailing your home's value as well as a comparison with similar homes in the area
Home Values in the Area
Average Home Value in this Area
Purchase History
| Date | Buyer | Sale Price | Title Company |
|---|---|---|---|
| Skupski Walter | $254,000 | Fidelity National Title | |
| Skupski Walter | $254,000 | Fidelity National Ttl Ins Co | |
| Peterson Craig A | $95,000 | None Available | |
| Griffin Marion | -- | None Available |
Source: Public Records
Mortgage History
| Date | Status | Borrower | Loan Amount |
|---|---|---|---|
| Previous Owner | Peterson Craig A | $71,250 |
Source: Public Records
Tax History Compared to Growth
Tax History
| Year | Tax Paid | Tax Assessment Tax Assessment Total Assessment is a certain percentage of the fair market value that is determined by local assessors to be the total taxable value of land and additions on the property. | Land | Improvement |
|---|---|---|---|---|
| 2025 | $3,038 | $126,000 | $30,000 | $96,000 |
| 2024 | $2,923 | $126,000 | $30,000 | $96,000 |
| 2023 | $2,869 | $126,000 | $30,000 | $96,000 |
| 2022 | $2,869 | $126,000 | $30,000 | $96,000 |
| 2021 | $2,557 | $126,000 | $30,000 | $96,000 |
| 2020 | $2,809 | $126,000 | $30,000 | $96,000 |
| 2019 | $2,730 | $126,000 | $30,000 | $96,000 |
| 2018 | $2,722 | $126,000 | $30,000 | $96,000 |
| 2017 | $2,621 | $126,000 | $30,000 | $96,000 |
| 2016 | $2,357 | $126,000 | $30,000 | $96,000 |
| 2015 | $2,285 | $126,000 | $30,000 | $96,000 |
| 2014 | $2,213 | $126,000 | $30,000 | $96,000 |
Source: Public Records
Map
Nearby Homes
- 227 Torrey Pines Dr
- 3 Muirhead St
- 15 Encinitas Dr
- 103 Troumaka St
- 30 Maracaibo Place
- 12 San Jacinto St
- 120 Bimini Dr
- 25 Purnell St
- 27 Maracaibo Place
- 380 Port Royal Dr
- 8 Doral Dr
- 70 Innsbruck Dr
- 14 Winterton Dr
- 246 Cabrillo Blvd
- 39 Innsbruck Dr
- 18 Morongo Ct
- 65 Innsbruck Dr
- 46 Encinitas Dr
- 71 Troumaka St
- 9 Banning Ct
- 5 Preston Ct
- 4 Preston Ct
- 3 Preston Ct
- 2 Preston Ct
- 1 Preston Ct
- 218 Torrey Pines Dr
- 215 Torrey Pines Dr
- 213 Torrey Pines Dr
- 220 Torrey Pines Dr
- 217 Torrey Pines Dr
- 210 Torrey Pines Dr
- 211 Torrey Pines Dr
- 222 Torrey Pines Dr
- 208 Torrey Pines Dr
- 221 Torrey Pines Dr
- 209 Torrey Pines Dr
- 318 Port Royal Dr
- 316 Port Royal Dr
- 223 Torrey Pines Dr
- 314 Port Royal Dr