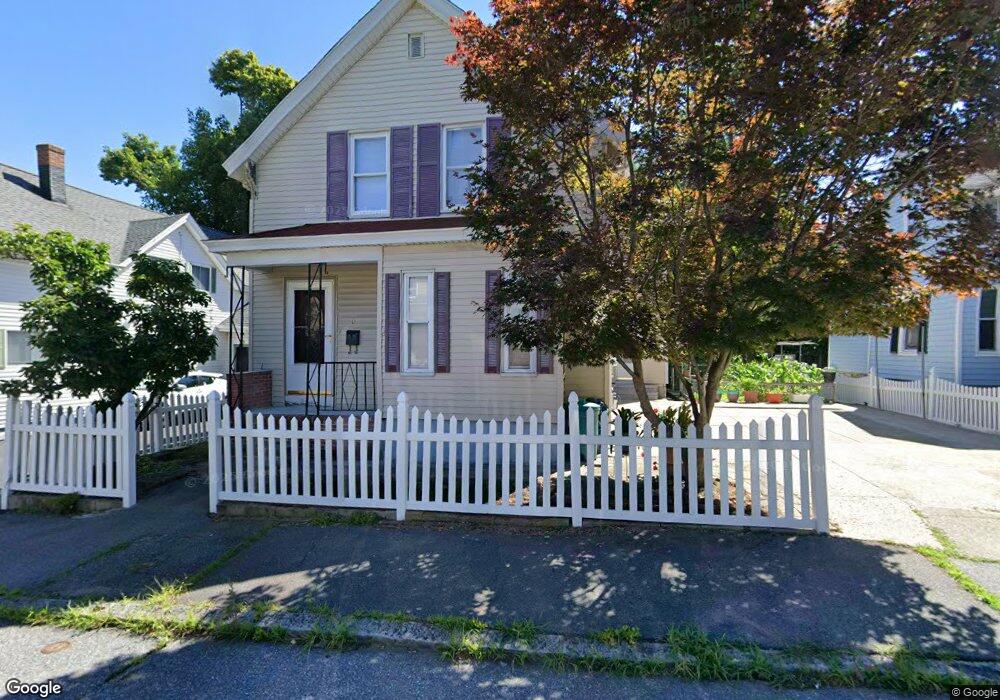
6 Puffer St Lowell, MA 01851
Lower Highlands NeighborhoodEstimated Value: $386,000 - $560,000
4
Beds
2
Baths
2,044
Sq Ft
$245/Sq Ft
Est. Value
About This Home
This home is located at 6 Puffer St, Lowell, MA 01851 and is currently estimated at $499,862, approximately $244 per square foot. 6 Puffer St is a home located in Middlesex County with nearby schools including Charles W. Morey Elementary School, Abraham Lincoln Elementary School, and Dr. Gertrude Bailey Elementary School.
Ownership History
Date
Name
Owned For
Owner Type
Purchase Details
Closed on
May 14, 2022
Sold by
Huynh John N
Bought by
Nguyen Thi
Current Estimated Value
Purchase Details
Closed on
Oct 30, 2013
Sold by
Huynh Duy T and Huynh John N
Bought by
Huynh John N
Home Financials for this Owner
Home Financials are based on the most recent Mortgage that was taken out on this home.
Original Mortgage
$74,000
Interest Rate
4.52%
Mortgage Type
New Conventional
Purchase Details
Closed on
Mar 21, 2012
Sold by
Huynh Huong and Nguyen Thi
Bought by
Huynh Duy T and Huynh John N
Home Financials for this Owner
Home Financials are based on the most recent Mortgage that was taken out on this home.
Original Mortgage
$79,000
Interest Rate
3.86%
Mortgage Type
New Conventional
Purchase Details
Closed on
Oct 4, 2010
Sold by
Huynh Huong
Bought by
Huynh Huong and Huynh Duy
Purchase Details
Closed on
Mar 1, 2002
Sold by
Hannon Jeffrey C and Hannon James P
Bought by
Huynh Huong
Purchase Details
Closed on
Nov 24, 1987
Sold by
Desjardins Paul J
Bought by
Hannon Jeffrey C
Create a Home Valuation Report for This Property
The Home Valuation Report is an in-depth analysis detailing your home's value as well as a comparison with similar homes in the area
Home Values in the Area
Average Home Value in this Area
Purchase History
| Date | Buyer | Sale Price | Title Company |
|---|---|---|---|
| Nguyen Thi | -- | None Available | |
| Nguyen Thi | -- | None Available | |
| Huynh John N | -- | -- | |
| Huynh John N | -- | -- | |
| Huynh John N | -- | -- | |
| Huynh Duy T | -- | -- | |
| Huynh Duy T | -- | -- | |
| Huynh Duy T | -- | -- | |
| Huynh Huong | -- | -- | |
| Huynh Huong | -- | -- | |
| Huynh Huong | $160,000 | -- | |
| Huynh Huong | $160,000 | -- | |
| Hannon Jeffrey C | $125,000 | -- |
Source: Public Records
Mortgage History
| Date | Status | Borrower | Loan Amount |
|---|---|---|---|
| Previous Owner | Huynh John N | $74,000 | |
| Previous Owner | Huynh Duy T | $79,000 |
Source: Public Records
Tax History
| Year | Tax Paid | Tax Assessment Tax Assessment Total Assessment is a certain percentage of the fair market value that is determined by local assessors to be the total taxable value of land and additions on the property. | Land | Improvement |
|---|---|---|---|---|
| 2025 | $5,120 | $446,000 | $134,400 | $311,600 |
| 2024 | $4,939 | $414,700 | $120,900 | $293,800 |
| 2023 | $4,664 | $375,500 | $105,200 | $270,300 |
| 2022 | $4,393 | $346,200 | $95,600 | $250,600 |
| 2021 | $4,099 | $304,500 | $83,100 | $221,400 |
| 2020 | $3,780 | $282,900 | $72,600 | $210,300 |
| 2019 | $3,559 | $253,500 | $67,300 | $186,200 |
| 2018 | $3,438 | $238,900 | $61,200 | $177,700 |
| 2017 | $3,300 | $221,200 | $55,600 | $165,600 |
| 2016 | $3,099 | $204,400 | $53,000 | $151,400 |
| 2015 | $3,009 | $194,400 | $54,200 | $140,200 |
| 2013 | $2,808 | $187,100 | $64,800 | $122,300 |
Source: Public Records
Map
Nearby Homes
- 85 B St
- 18 Burgess St
- 710 School St
- 11 Warwick St Unit 3
- 186 Powell St
- 137 Pine St Unit 11
- 15 Barclay St
- 525 Chelmsford St
- 108 Inland St
- 17 Edson St
- 68 Smith St
- 3 Butman Place
- 312 Wilder St
- 37 Saint Paul St
- 142 Sanders Ave
- 118 Sanders Ave
- 143 Westford St
- 42 Branch St
- 84 Cambridge St
- 173 Princeton Blvd
Your Personal Tour Guide
Ask me questions while you tour the home.