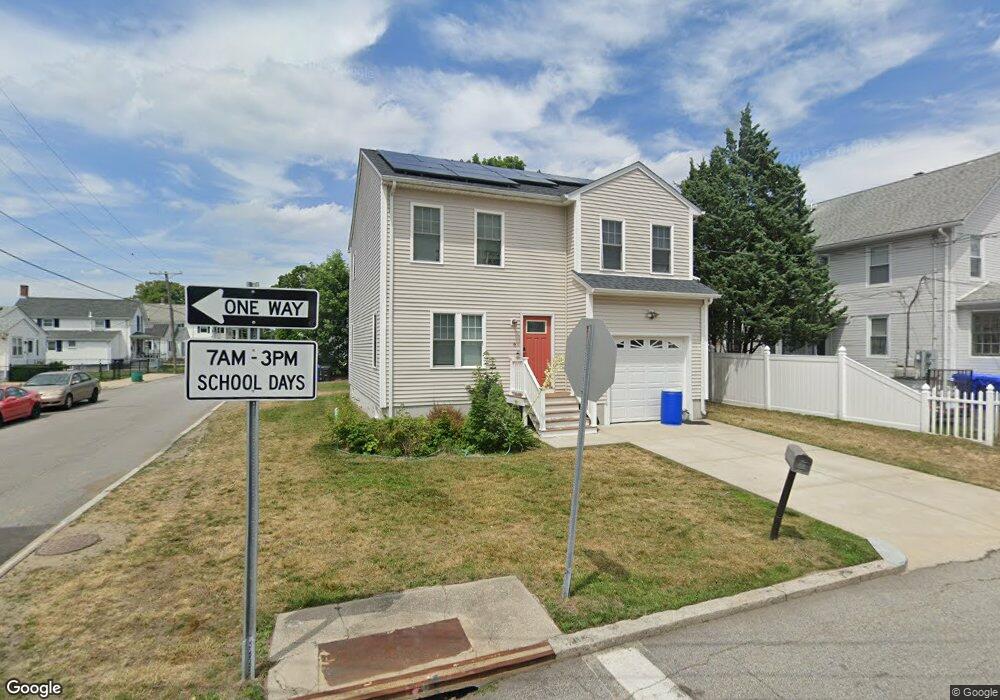
6 Pullen Ave Pawtucket, RI 02861
Darlington NeighborhoodEstimated Value: $443,000 - $523,000
3
Beds
2
Baths
1,670
Sq Ft
$288/Sq Ft
Est. Value
About This Home
This home is located at 6 Pullen Ave, Pawtucket, RI 02861 and is currently estimated at $481,772, approximately $288 per square foot. 6 Pullen Ave is a home with nearby schools including St Cecilia School and Saint Teresa Catholic Elementary School.
Ownership History
Date
Name
Owned For
Owner Type
Purchase Details
Closed on
Aug 31, 2018
Sold by
Fernandes James A and Fernandes Mark P
Bought by
Tarwoe Gold Star Rt
Current Estimated Value
Purchase Details
Closed on
Jun 4, 2015
Sold by
Wilcox Nancy J and Wilcox Paul M
Bought by
Fernandes James A and Fernandes Mark P
Purchase Details
Closed on
Mar 7, 2014
Sold by
Tracy Cynthia A and Tracy Paul D
Bought by
Wilcox Nancy J and Wilcox Paul M
Create a Home Valuation Report for This Property
The Home Valuation Report is an in-depth analysis detailing your home's value as well as a comparison with similar homes in the area
Home Values in the Area
Average Home Value in this Area
Purchase History
| Date | Buyer | Sale Price | Title Company |
|---|---|---|---|
| Tarwoe Gold Star Rt | $289,900 | -- | |
| Fernandes James A | $30,000 | -- | |
| Wilcox Nancy J | -- | -- |
Source: Public Records
Mortgage History
| Date | Status | Borrower | Loan Amount |
|---|---|---|---|
| Previous Owner | Fernandes James A | $62,000 | |
| Previous Owner | Fernandes James A | $44,000 |
Source: Public Records
Tax History
| Year | Tax Paid | Tax Assessment Tax Assessment Total Assessment is a certain percentage of the fair market value that is determined by local assessors to be the total taxable value of land and additions on the property. | Land | Improvement |
|---|---|---|---|---|
| 2025 | $5,487 | $417,300 | $145,200 | $272,100 |
| 2024 | $5,149 | $417,300 | $145,200 | $272,100 |
| 2023 | $5,863 | $346,100 | $76,600 | $269,500 |
| 2022 | $5,738 | $346,100 | $76,600 | $269,500 |
| 2021 | $5,738 | $346,100 | $76,600 | $269,500 |
| 2020 | $6,027 | $288,500 | $63,900 | $224,600 |
| 2019 | $6,027 | $288,500 | $63,900 | $224,600 |
| 2018 | $1,286 | $63,900 | $63,900 | $0 |
| 2017 | $1,125 | $49,500 | $49,500 | $0 |
| 2016 | $1,084 | $49,500 | $49,500 | $0 |
| 2015 | $324 | $14,800 | $14,800 | $0 |
| 2014 | -- | $14,800 | $14,800 | $0 |
Source: Public Records
Map
Nearby Homes
Your Personal Tour Guide
Ask me questions while you tour the home.