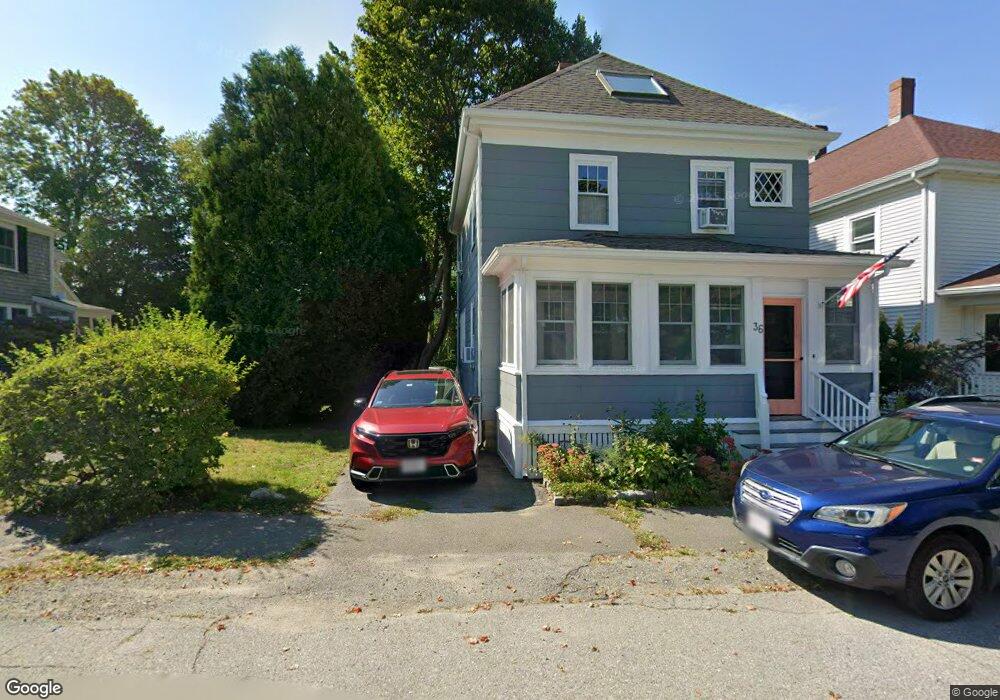
6 Putnam Ct Manchester, MA 01944
Estimated Value: $1,603,186 - $2,092,000
4
Beds
4
Baths
3,055
Sq Ft
$601/Sq Ft
Est. Value
About This Home
This home is located at 6 Putnam Ct, Manchester, MA 01944 and is currently estimated at $1,836,047, approximately $600 per square foot. 6 Putnam Ct is a home located in Essex County with nearby schools including Manchester Essex Regional High School, Tara Montessori School, and Glen Urquhart School.
Ownership History
Date
Name
Owned For
Owner Type
Purchase Details
Closed on
Oct 5, 2022
Sold by
Lee Rt and Lee
Bought by
Aam Danvers Residences
Current Estimated Value
Purchase Details
Closed on
Aug 14, 2015
Sold by
Boyle Fletcher J
Bought by
Boyle Fletcher G and Boyle Shari T
Purchase Details
Closed on
Oct 2, 1989
Sold by
Connors Marguerite
Bought by
Lee Rt
Home Financials for this Owner
Home Financials are based on the most recent Mortgage that was taken out on this home.
Original Mortgage
$185,000
Interest Rate
9.92%
Mortgage Type
Purchase Money Mortgage
Create a Home Valuation Report for This Property
The Home Valuation Report is an in-depth analysis detailing your home's value as well as a comparison with similar homes in the area
Home Values in the Area
Average Home Value in this Area
Purchase History
| Date | Buyer | Sale Price | Title Company |
|---|---|---|---|
| Aam Danvers Residences | $2,590,800 | None Available | |
| Boyle Fletcher G | -- | -- | |
| Lee Rt | $185,000 | -- |
Source: Public Records
Mortgage History
| Date | Status | Borrower | Loan Amount |
|---|---|---|---|
| Previous Owner | Lee Rt | $150,000 | |
| Previous Owner | Lee Rt | $185,000 |
Source: Public Records
Tax History
| Year | Tax Paid | Tax Assessment Tax Assessment Total Assessment is a certain percentage of the fair market value that is determined by local assessors to be the total taxable value of land and additions on the property. | Land | Improvement |
|---|---|---|---|---|
| 2025 | $11,685 | $1,277,000 | $416,100 | $860,900 |
| 2024 | $11,154 | $1,192,900 | $396,300 | $796,600 |
| 2023 | $10,889 | $1,044,000 | $355,000 | $689,000 |
| 2022 | $10,204 | $962,600 | $322,000 | $640,600 |
| 2021 | $9,870 | $898,100 | $322,000 | $576,100 |
| 2020 | $9,982 | $853,200 | $305,500 | $547,700 |
| 2019 | $9,529 | $848,500 | $290,600 | $557,900 |
| 2018 | $9,359 | $848,500 | $290,600 | $557,900 |
| 2017 | $9,043 | $822,100 | $264,200 | $557,900 |
| 2016 | $8,896 | $803,600 | $264,200 | $539,400 |
| 2015 | $4,048 | $373,400 | $247,700 | $125,700 |
Source: Public Records
Map
Nearby Homes
Your Personal Tour Guide
Ask me questions while you tour the home.