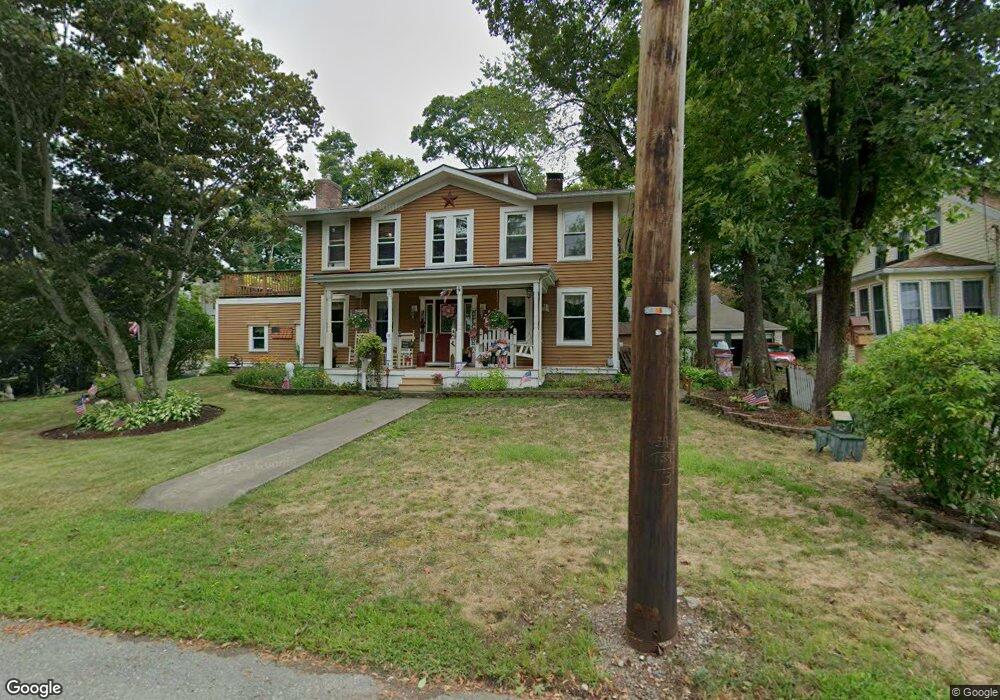
6 Ralph St North Attleboro, MA 02760
North Attleboro NeighborhoodEstimated Value: $495,000 - $572,000
4
Beds
1
Bath
2,156
Sq Ft
$247/Sq Ft
Est. Value
About This Home
This home is located at 6 Ralph St, North Attleboro, MA 02760 and is currently estimated at $531,559, approximately $246 per square foot. 6 Ralph St is a home located in Bristol County with nearby schools including North Attleboro High School, Cadence Academy Preschool - North Attleborough, and Bishop Feehan High School.
Ownership History
Date
Name
Owned For
Owner Type
Purchase Details
Closed on
Mar 12, 2004
Sold by
Marino Joseph B and Marino Loma L
Bought by
Marino Joseph B and Marino Lorna L
Current Estimated Value
Home Financials for this Owner
Home Financials are based on the most recent Mortgage that was taken out on this home.
Original Mortgage
$163,500
Outstanding Balance
$76,413
Interest Rate
5.67%
Estimated Equity
$455,146
Purchase Details
Closed on
Jul 29, 1994
Sold by
Fdic
Bought by
Marino Joseph B and Marino Loma L
Home Financials for this Owner
Home Financials are based on the most recent Mortgage that was taken out on this home.
Original Mortgage
$94,600
Interest Rate
8.25%
Create a Home Valuation Report for This Property
The Home Valuation Report is an in-depth analysis detailing your home's value as well as a comparison with similar homes in the area
Home Values in the Area
Average Home Value in this Area
Purchase History
| Date | Buyer | Sale Price | Title Company |
|---|---|---|---|
| Marino Joseph B | -- | -- | |
| Marino Joseph B | $95,500 | -- |
Source: Public Records
Mortgage History
| Date | Status | Borrower | Loan Amount |
|---|---|---|---|
| Open | Marino Joseph B | $163,500 | |
| Previous Owner | Marino Joseph B | $127,653 | |
| Previous Owner | Marino Joseph B | $115,800 | |
| Previous Owner | Marino Joseph B | $94,600 |
Source: Public Records
Tax History Compared to Growth
Tax History
| Year | Tax Paid | Tax Assessment Tax Assessment Total Assessment is a certain percentage of the fair market value that is determined by local assessors to be the total taxable value of land and additions on the property. | Land | Improvement |
|---|---|---|---|---|
| 2025 | $4,720 | $400,300 | $124,700 | $275,600 |
| 2024 | $4,696 | $406,900 | $124,700 | $282,200 |
| 2023 | $4,556 | $356,200 | $124,700 | $231,500 |
| 2022 | $4,363 | $313,200 | $124,700 | $188,500 |
| 2021 | $4,437 | $310,900 | $124,700 | $186,200 |
| 2020 | $4,384 | $305,500 | $124,700 | $180,800 |
| 2019 | $4,189 | $294,200 | $113,400 | $180,800 |
| 2018 | $3,781 | $283,400 | $113,400 | $170,000 |
| 2017 | $3,747 | $283,400 | $113,400 | $170,000 |
| 2016 | $3,653 | $276,300 | $126,000 | $150,300 |
| 2015 | $3,596 | $273,700 | $132,300 | $141,400 |
| 2014 | $3,491 | $263,700 | $122,300 | $141,400 |
Source: Public Records
Map
Nearby Homes
- 93 Bank St
- 151 Roosevelt Ave Unit A
- 85 Richards Ave
- 16 Richards Ave Unit 106
- 33 Ash St
- 19 Church St Unit A5
- 80 Broadway Unit 9
- 20 Holbrook Ave
- 99 Arnold Rd
- 12 Roosevelt Ave
- 60 Crescent Ave
- 16 Johnson St
- 58 Jay St
- 19 Metcalf Cir
- 160 Crescent Ave
- 300 E Washington St Unit 4M
- 300 E Washington St Unit 54R
- 50 Metcalf Rd
- 68 Fisher St
- 880 Landry Ave Unit 2