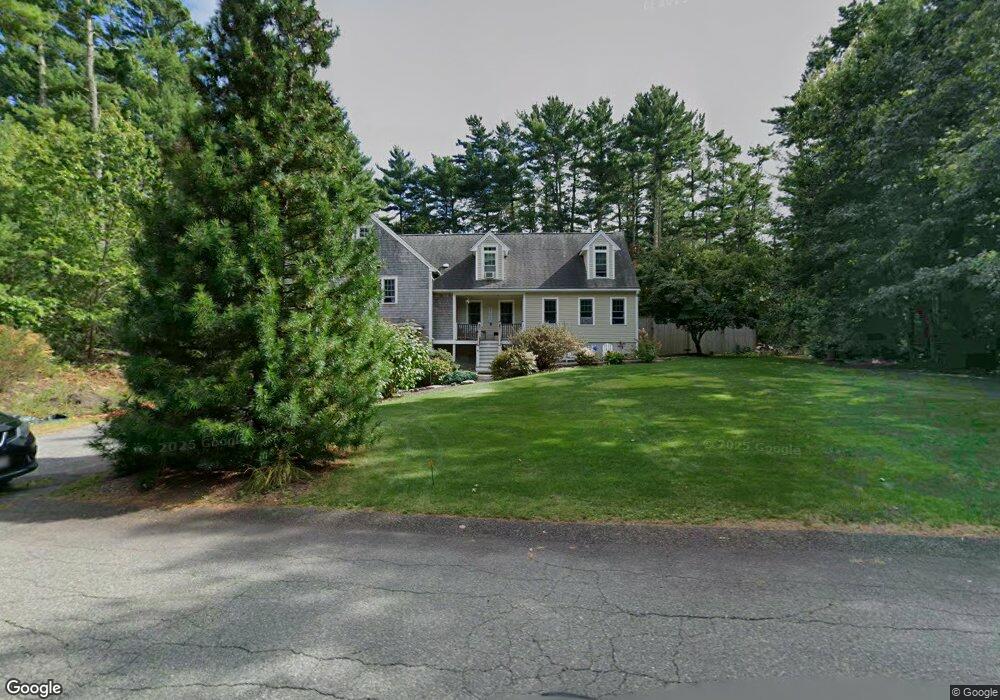
6 Richfield Cir Carver, MA 02330
Estimated Value: $646,273 - $735,000
3
Beds
2
Baths
2,218
Sq Ft
$312/Sq Ft
Est. Value
About This Home
This home is located at 6 Richfield Cir, Carver, MA 02330 and is currently estimated at $692,318, approximately $312 per square foot. 6 Richfield Cir is a home located in Plymouth County with nearby schools including Carver Elementary School and Samuel Fuller School.
Ownership History
Date
Name
Owned For
Owner Type
Purchase Details
Closed on
Apr 18, 2025
Sold by
Keefe Linda L
Bought by
Keefe Ft and Keefe
Current Estimated Value
Purchase Details
Closed on
Aug 6, 2007
Sold by
Gentile Salvatore J and Keefe Linda L
Bought by
Keefe Linda L
Create a Home Valuation Report for This Property
The Home Valuation Report is an in-depth analysis detailing your home's value as well as a comparison with similar homes in the area
Home Values in the Area
Average Home Value in this Area
Purchase History
| Date | Buyer | Sale Price | Title Company |
|---|---|---|---|
| Keefe Ft | -- | None Available | |
| Keefe Ft | -- | None Available | |
| Keefe Linda L | -- | -- | |
| Keefe Linda L | -- | -- |
Source: Public Records
Mortgage History
| Date | Status | Borrower | Loan Amount |
|---|---|---|---|
| Previous Owner | Keefe Linda L | $154,100 | |
| Previous Owner | Keefe Linda L | $155,400 |
Source: Public Records
Tax History Compared to Growth
Tax History
| Year | Tax Paid | Tax Assessment Tax Assessment Total Assessment is a certain percentage of the fair market value that is determined by local assessors to be the total taxable value of land and additions on the property. | Land | Improvement |
|---|---|---|---|---|
| 2025 | $8,039 | $579,600 | $158,600 | $421,000 |
| 2024 | $7,629 | $538,400 | $155,500 | $382,900 |
| 2023 | $7,334 | $502,700 | $155,500 | $347,200 |
| 2022 | $6,975 | $436,500 | $132,900 | $303,600 |
| 2021 | $6,646 | $392,300 | $118,700 | $273,600 |
| 2020 | $6,379 | $371,100 | $110,900 | $260,200 |
| 2019 | $6,155 | $361,000 | $107,700 | $253,300 |
| 2018 | $5,799 | $328,900 | $107,700 | $221,200 |
| 2017 | $5,546 | $313,500 | $103,600 | $209,900 |
| 2016 | $5,143 | $302,000 | $98,700 | $203,300 |
| 2015 | $4,992 | $293,500 | $98,700 | $194,800 |
| 2014 | $4,911 | $288,700 | $124,700 | $164,000 |
Source: Public Records
Map
Nearby Homes
- 35 Silva St
- 81 Center St
- 64 Wenham Rd
- 11 Brockton Ave
- 135 Plymouth St
- 23 Shaw St
- 7 Green St
- 6 Kestrel Way
- 6 Susan Cir
- 26 Santana Way Unit 26
- 5 Carver Square Blvd Unit 5
- 5 Carver Square Blvd
- 235 Main St
- 6 Twin Pines Ln Unit 6
- 6 Fairway
- 122 High St
- 48 S Meadow Village
- 22 S Meadow Village
- 29 S Meadow Village
- 0 Spring St