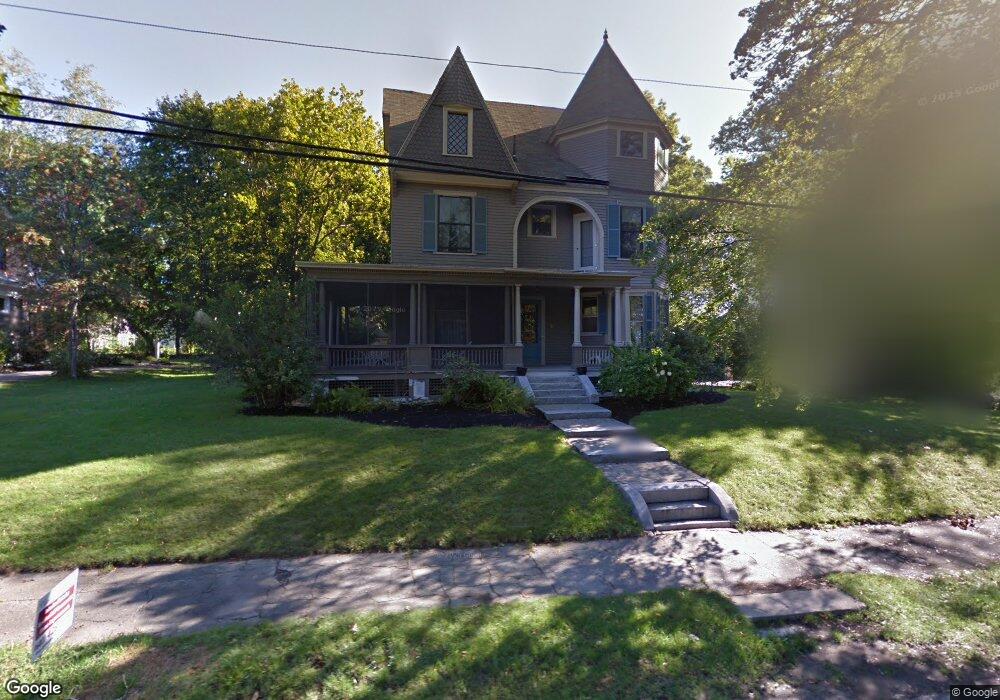
6 Ridge Rd Concord, NH 03301
North End NeighborhoodEstimated Value: $659,991 - $895,000
4
Beds
3
Baths
2,602
Sq Ft
$284/Sq Ft
Est. Value
About This Home
This home is located at 6 Ridge Rd, Concord, NH 03301 and is currently estimated at $738,248, approximately $283 per square foot. 6 Ridge Rd is a home located in Merrimack County with nearby schools including Christa McAuliffe School, Rundlett Middle School, and Concord High School.
Ownership History
Date
Name
Owned For
Owner Type
Purchase Details
Closed on
Feb 14, 2020
Sold by
Ludtke Leslie J and Owers James E
Bought by
Owers-Ludtke Ft
Current Estimated Value
Purchase Details
Closed on
May 27, 1999
Sold by
Behrens Thomas A
Bought by
Salvatore David M and Salvatore Rosemary M
Purchase Details
Closed on
May 28, 1992
Bought by
Owers James and Ludtke Leslie
Create a Home Valuation Report for This Property
The Home Valuation Report is an in-depth analysis detailing your home's value as well as a comparison with similar homes in the area
Home Values in the Area
Average Home Value in this Area
Purchase History
| Date | Buyer | Sale Price | Title Company |
|---|---|---|---|
| Owers-Ludtke Ft | -- | None Available | |
| Salvatore David M | $245,000 | -- | |
| Owers James | $200,000 | -- |
Source: Public Records
Tax History Compared to Growth
Tax History
| Year | Tax Paid | Tax Assessment Tax Assessment Total Assessment is a certain percentage of the fair market value that is determined by local assessors to be the total taxable value of land and additions on the property. | Land | Improvement |
|---|---|---|---|---|
| 2024 | $13,081 | $472,400 | $169,500 | $302,900 |
| 2023 | $12,689 | $472,400 | $169,500 | $302,900 |
| 2022 | $12,230 | $472,400 | $169,500 | $302,900 |
| 2021 | $11,729 | $466,900 | $169,500 | $297,400 |
| 2020 | $11,049 | $412,900 | $141,700 | $271,200 |
| 2019 | $11,265 | $405,500 | $141,700 | $263,800 |
| 2018 | $11,118 | $394,400 | $134,900 | $259,500 |
| 2017 | $12,132 | $429,600 | $139,200 | $290,400 |
| 2016 | $11,447 | $413,700 | $139,200 | $274,500 |
| 2015 | $11,084 | $405,400 | $115,000 | $290,400 |
| 2014 | $10,719 | $405,400 | $115,000 | $290,400 |
| 2013 | -- | $402,600 | $115,000 | $287,600 |
| 2012 | -- | $420,700 | $115,000 | $305,700 |
Source: Public Records
Map
Nearby Homes
- 17 Essex St
- 2 Kensington Rd
- 1 Kensington Rd
- 119 Rumford St
- 11 Pleasant View Ave
- 54 Pleasant St Unit 8
- 30 Jackson St
- 10 N State St
- 25 Fayette St
- 8 Tremont St
- 157 Rumford St
- 11 Washington St
- 37 Thorndike St
- 75 S State St
- 14-16 Perley St
- 14 Downing St
- 10 Perley St
- 6 Herbert St
- 2 Herbert St
- 87 S Main St Unit 2