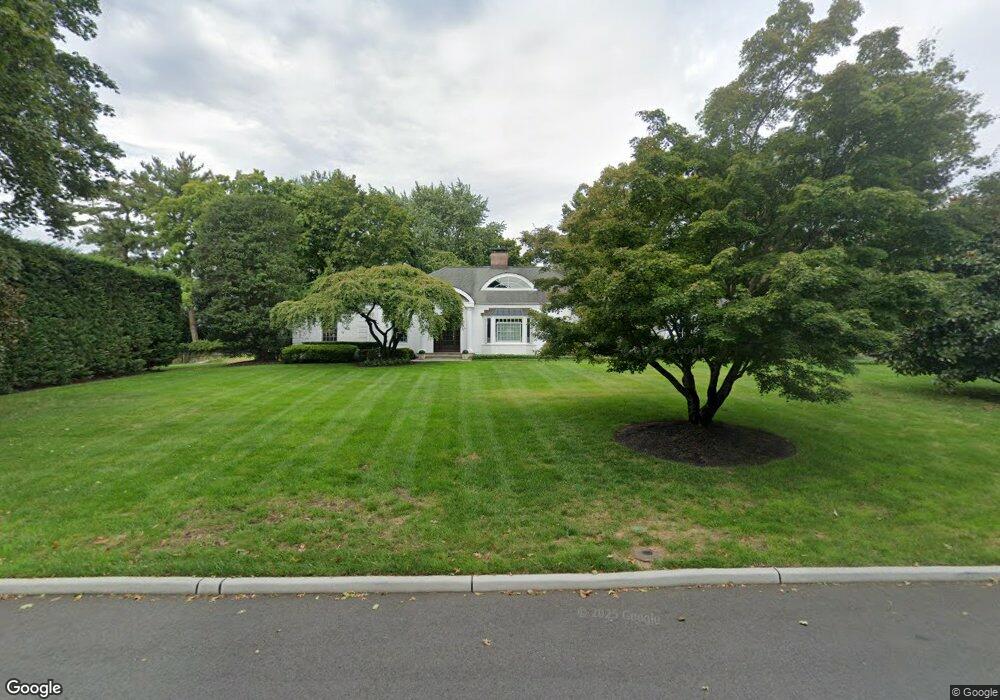
6 Riverside Dr Rumson, NJ 07760
Estimated Value: $2,236,000 - $2,715,000
4
Beds
3
Baths
3,480
Sq Ft
$684/Sq Ft
Est. Value
About This Home
This home is located at 6 Riverside Dr, Rumson, NJ 07760 and is currently estimated at $2,379,532, approximately $683 per square foot. 6 Riverside Dr is a home located in Monmouth County with nearby schools including Deane Porter School, Forrestdale School, and Rumson Fair Haven Regional High School.
Ownership History
Date
Name
Owned For
Owner Type
Purchase Details
Closed on
Sep 21, 2016
Sold by
Ferrante Valerie Hemhauser
Bought by
Ferrante Valerie
Current Estimated Value
Purchase Details
Closed on
Aug 4, 2000
Sold by
Clapham Mary
Bought by
Ferrante Valerie
Home Financials for this Owner
Home Financials are based on the most recent Mortgage that was taken out on this home.
Original Mortgage
$300,000
Outstanding Balance
$108,700
Interest Rate
8.21%
Estimated Equity
$2,270,832
Create a Home Valuation Report for This Property
The Home Valuation Report is an in-depth analysis detailing your home's value as well as a comparison with similar homes in the area
Home Values in the Area
Average Home Value in this Area
Purchase History
| Date | Buyer | Sale Price | Title Company |
|---|---|---|---|
| Ferrante Valerie | -- | None Available | |
| Ferrante Valerie | $611,000 | -- |
Source: Public Records
Mortgage History
| Date | Status | Borrower | Loan Amount |
|---|---|---|---|
| Open | Ferrante Valerie | $300,000 |
Source: Public Records
Tax History
| Year | Tax Paid | Tax Assessment Tax Assessment Total Assessment is a certain percentage of the fair market value that is determined by local assessors to be the total taxable value of land and additions on the property. | Land | Improvement |
|---|---|---|---|---|
| 2025 | $18,454 | $1,772,900 | $1,524,200 | $248,700 |
| 2024 | $18,647 | $1,677,600 | $1,451,300 | $226,300 |
Source: Public Records
Map
Nearby Homes
- 420 Rumson Rd
- 492 Hance Rd
- 45 Wardell Ave
- 55 Cheshire Square Unit 27
- 162 Queens Dr S
- 281 Hance Rd
- 7 Rutgers Dr
- 87 Rumson Rd
- 94 Park Ave
- 91 Forrest Ave
- 224 Fair Haven Rd
- 82 Church St
- 255 3rd St
- 148 Ambassador Dr Unit 1054/J-2
- 69 Winding Way
- 40 Brookside Ln
- 1 Clifford Graves Ct
- 212 Willow Dr
- 59 Windward Way
- 1 Spinaker Ln
Your Personal Tour Guide
Ask me questions while you tour the home.