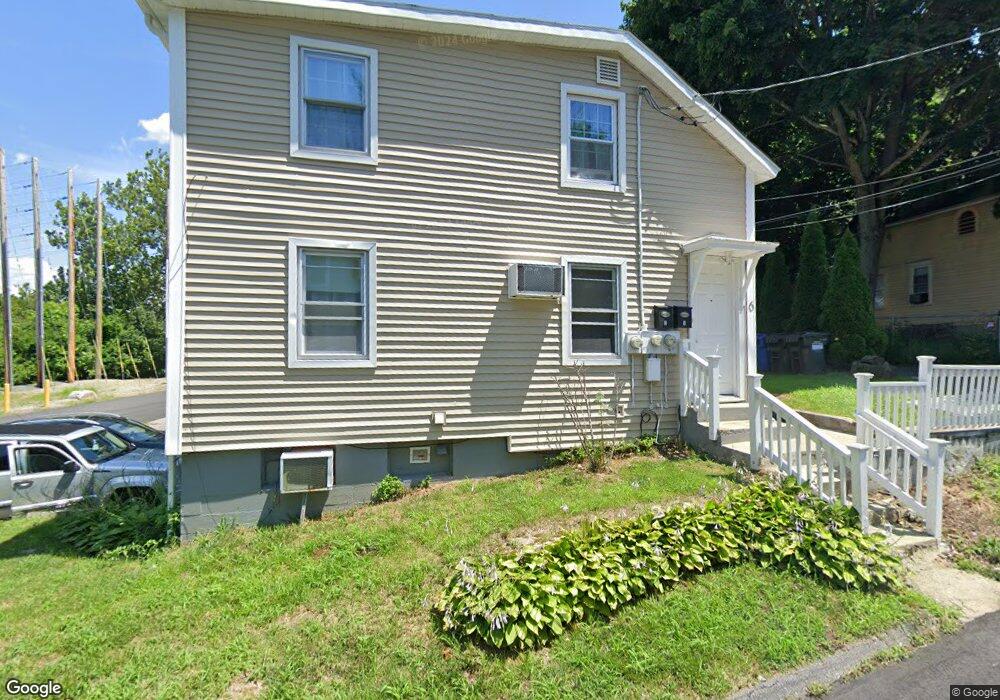
6 Rock St Norwich, CT 06360
Central Norwich NeighborhoodEstimated Value: $205,000 - $281,000
2
Beds
2
Baths
1,035
Sq Ft
$227/Sq Ft
Est. Value
About This Home
This home is located at 6 Rock St, Norwich, CT 06360 and is currently estimated at $235,422, approximately $227 per square foot. 6 Rock St is a home located in New London County with nearby schools including Veterans' Memorial Elementary School, Kelly STEAM Magnet Middle School, and Integrated Day Charter School.
Ownership History
Date
Name
Owned For
Owner Type
Purchase Details
Closed on
Jan 16, 2004
Sold by
Borys Simon and Borys Kathleen
Bought by
Piantini Mario and Rodriguez Ana
Current Estimated Value
Home Financials for this Owner
Home Financials are based on the most recent Mortgage that was taken out on this home.
Original Mortgage
$100,800
Interest Rate
5.98%
Mortgage Type
Purchase Money Mortgage
Purchase Details
Closed on
Jun 24, 1994
Sold by
Usa
Bought by
Borys Simon and Borys Kathleen
Purchase Details
Closed on
Jul 28, 1993
Sold by
Rooney Christopher W and Rooney Linda
Bought by
Usa
Create a Home Valuation Report for This Property
The Home Valuation Report is an in-depth analysis detailing your home's value as well as a comparison with similar homes in the area
Home Values in the Area
Average Home Value in this Area
Purchase History
| Date | Buyer | Sale Price | Title Company |
|---|---|---|---|
| Piantini Mario | $126,000 | -- | |
| Piantini Mario | $126,000 | -- | |
| Borys Simon | $20,000 | -- | |
| Borys Simon | $20,000 | -- | |
| Usa | $52,400 | -- | |
| Usa | $52,400 | -- |
Source: Public Records
Mortgage History
| Date | Status | Borrower | Loan Amount |
|---|---|---|---|
| Open | Usa | $155,500 | |
| Closed | Usa | $100,800 |
Source: Public Records
Tax History Compared to Growth
Tax History
| Year | Tax Paid | Tax Assessment Tax Assessment Total Assessment is a certain percentage of the fair market value that is determined by local assessors to be the total taxable value of land and additions on the property. | Land | Improvement |
|---|---|---|---|---|
| 2025 | $3,359 | $83,000 | $24,500 | $58,500 |
| 2024 | $3,171 | $83,000 | $24,500 | $58,500 |
| 2023 | $2,393 | $49,200 | $12,100 | $37,100 |
| 2022 | $2,385 | $49,200 | $12,100 | $37,100 |
| 2021 | $2,393 | $49,200 | $12,100 | $37,100 |
| 2020 | $2,385 | $49,200 | $12,100 | $37,100 |
| 2019 | $2,361 | $49,200 | $12,100 | $37,100 |
| 2018 | $2,061 | $42,600 | $11,400 | $31,200 |
| 2017 | $2,076 | $42,600 | $11,400 | $31,200 |
| 2016 | $2,090 | $42,600 | $11,400 | $31,200 |
| 2015 | $2,033 | $42,300 | $11,400 | $30,900 |
| 2014 | $1,943 | $42,300 | $11,400 | $30,900 |
Source: Public Records
Map
Nearby Homes