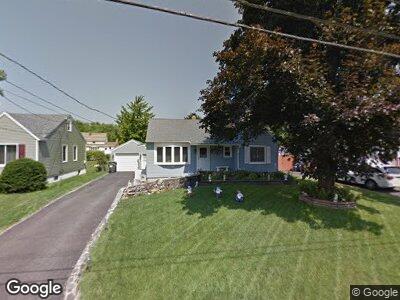
6 Rondack Rd Albany, NY 12205
West Albany NeighborhoodEstimated Value: $254,000 - $296,000
3
Beds
1
Bath
1,099
Sq Ft
$244/Sq Ft
Est. Value
About This Home
This home is located at 6 Rondack Rd, Albany, NY 12205 and is currently estimated at $268,144, approximately $243 per square foot. 6 Rondack Rd is a home located in Albany County with nearby schools including Sand Creek Middle School, Shaker Road Elementary School, and Colonie Central High School.
Ownership History
Date
Name
Owned For
Owner Type
Purchase Details
Closed on
Mar 27, 2008
Sold by
Sheller Thomas
Bought by
Sheller Thomas
Current Estimated Value
Purchase Details
Closed on
Aug 26, 2004
Purchase Details
Closed on
Aug 9, 2001
Purchase Details
Closed on
Mar 14, 1997
Sold by
Yadack Lynda
Bought by
Stewart Dorothy A
Create a Home Valuation Report for This Property
The Home Valuation Report is an in-depth analysis detailing your home's value as well as a comparison with similar homes in the area
Home Values in the Area
Average Home Value in this Area
Purchase History
| Date | Buyer | Sale Price | Title Company |
|---|---|---|---|
| Sheller Thomas | -- | -- | |
| Sheller Thomas P | -- | None Available | |
| -- | -- | -- | |
| -- | -- | -- | |
| Stewart Dorothy A | $87,500 | -- |
Source: Public Records
Mortgage History
| Date | Status | Borrower | Loan Amount |
|---|---|---|---|
| Open | Sheller Thomas P | $32,880 | |
| Open | Sheller Thomas P | $159,000 | |
| Closed | Sheller Thomas P | $154,400 | |
| Closed | Sheller Thomas P | $15,000 |
Source: Public Records
Tax History Compared to Growth
Tax History
| Year | Tax Paid | Tax Assessment Tax Assessment Total Assessment is a certain percentage of the fair market value that is determined by local assessors to be the total taxable value of land and additions on the property. | Land | Improvement |
|---|---|---|---|---|
| 2024 | $3,997 | $86,000 | $21,500 | $64,500 |
| 2023 | $3,922 | $86,000 | $21,500 | $64,500 |
| 2022 | $3,837 | $86,000 | $21,500 | $64,500 |
| 2021 | $3,786 | $86,000 | $21,500 | $64,500 |
| 2020 | $3,166 | $86,000 | $21,500 | $64,500 |
| 2019 | $1,807 | $86,000 | $21,500 | $64,500 |
| 2018 | $3,051 | $86,000 | $21,500 | $64,500 |
| 2017 | $0 | $86,000 | $21,500 | $64,500 |
| 2016 | $2,987 | $86,000 | $21,500 | $64,500 |
| 2015 | -- | $86,000 | $21,500 | $64,500 |
| 2014 | -- | $86,000 | $21,500 | $64,500 |
Source: Public Records
Map
Nearby Homes