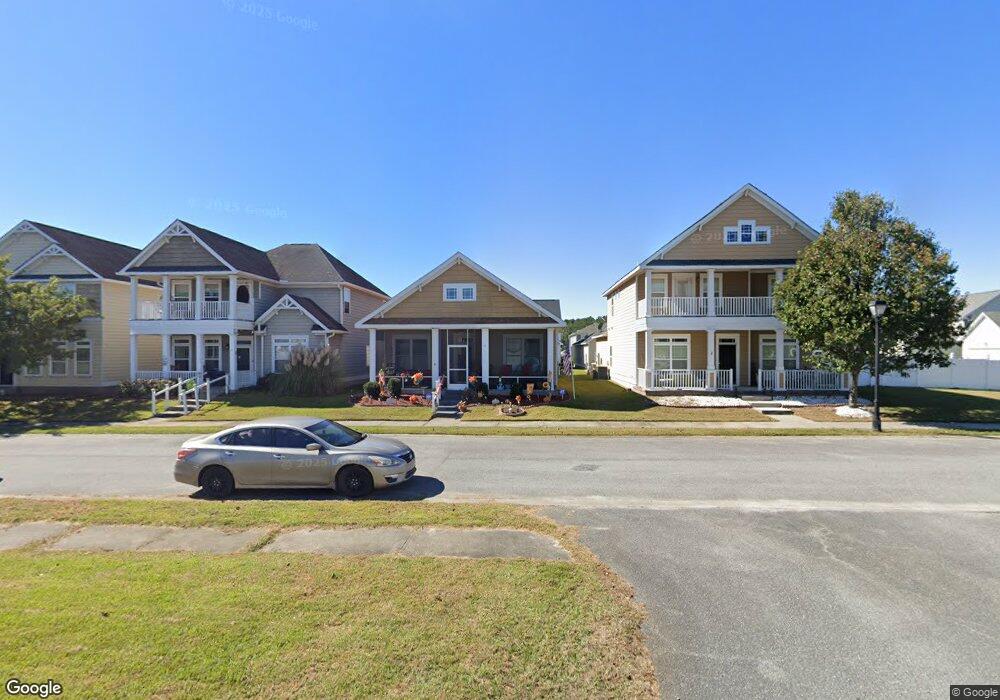
6 Sandy Shoals Pass Savannah, GA 31407
Estimated Value: $282,000 - $291,872
3
Beds
2
Baths
1,309
Sq Ft
$220/Sq Ft
Est. Value
About This Home
This home is located at 6 Sandy Shoals Pass, Savannah, GA 31407 and is currently estimated at $288,468, approximately $220 per square foot. 6 Sandy Shoals Pass is a home located in Chatham County with nearby schools including Rice Creek K-8 School and Groves High School.
Ownership History
Date
Name
Owned For
Owner Type
Purchase Details
Closed on
Jan 27, 2025
Sold by
Haynes-Paige Loisjean
Bought by
Paige Lois Jean Tr
Current Estimated Value
Purchase Details
Closed on
Dec 23, 2021
Sold by
Tootle Kevin J
Bought by
Haynes Paige Loisjean
Purchase Details
Closed on
Sep 16, 2019
Sold by
Fjack Holdings Llc
Bought by
Tootle Kevin J and Tootle Bobbie N
Home Financials for this Owner
Home Financials are based on the most recent Mortgage that was taken out on this home.
Original Mortgage
$162,011
Interest Rate
3.6%
Mortgage Type
FHA
Purchase Details
Closed on
Aug 31, 2018
Sold by
Copeland Velma A
Bought by
Fjack Holdings Llc
Home Financials for this Owner
Home Financials are based on the most recent Mortgage that was taken out on this home.
Original Mortgage
$101,600
Interest Rate
4.6%
Mortgage Type
Commercial
Purchase Details
Closed on
Aug 29, 2014
Sold by
Miller Sara Hudson
Bought by
Copeland Velma A
Purchase Details
Closed on
Dec 4, 2007
Sold by
Not Provided
Bought by
Hudson and Miller Sara & Daniel
Home Financials for this Owner
Home Financials are based on the most recent Mortgage that was taken out on this home.
Original Mortgage
$166,484
Interest Rate
6.22%
Mortgage Type
FHA
Create a Home Valuation Report for This Property
The Home Valuation Report is an in-depth analysis detailing your home's value as well as a comparison with similar homes in the area
Home Values in the Area
Average Home Value in this Area
Purchase History
| Date | Buyer | Sale Price | Title Company |
|---|---|---|---|
| Paige Lois Jean Tr | -- | -- | |
| Haynes Paige Loisjean | $215,500 | -- | |
| Tootle Kevin J | $165,000 | -- | |
| Fjack Holdings Llc | $127,000 | -- | |
| Copeland Velma A | $154,000 | -- | |
| Hudson | -- | -- |
Source: Public Records
Mortgage History
| Date | Status | Borrower | Loan Amount |
|---|---|---|---|
| Previous Owner | Tootle Kevin J | $162,011 | |
| Previous Owner | Fjack Holdings Llc | $101,600 | |
| Previous Owner | Hudson | $166,484 |
Source: Public Records
Tax History Compared to Growth
Tax History
| Year | Tax Paid | Tax Assessment Tax Assessment Total Assessment is a certain percentage of the fair market value that is determined by local assessors to be the total taxable value of land and additions on the property. | Land | Improvement |
|---|---|---|---|---|
| 2025 | $2,368 | $91,800 | $20,000 | $71,800 |
| 2024 | $2,368 | $84,320 | $20,000 | $64,320 |
| 2023 | $1,572 | $77,640 | $14,000 | $63,640 |
| 2022 | $2,011 | $71,640 | $14,000 | $57,640 |
| 2021 | $2,012 | $59,440 | $14,000 | $45,440 |
| 2020 | $1,757 | $58,080 | $14,000 | $44,080 |
| 2019 | $1,757 | $50,800 | $10,465 | $40,335 |
| 2018 | $1,715 | $52,400 | $8,000 | $44,400 |
| 2017 | $1,705 | $52,680 | $8,000 | $44,680 |
| 2016 | $1,705 | $52,080 | $8,000 | $44,080 |
| 2015 | $1,720 | $52,440 | $8,000 | $44,440 |
| 2014 | $1,973 | $46,320 | $0 | $0 |
Source: Public Records
Map
Nearby Homes
- 6 Sandy Shoals Pass
- 8 Sandy Shoals Pass Unit 170
- 8 Sandy Shoals Pass
- 4 Sandy Shoals Pass
- 8 Sandy Shoals Pass Unit 170
- 8 Sandy Shoals Pass
- 4 Sandy Shoals Pass
- 10 Sandy Shoals Pass
- 10 Sandy Shoals Pass
- 509 Flat Rock Trace
- 509 Flat Rock Trace
- 511 Flat Rock Trace
- 511 Flat Rock Trace
- 507 Flat Rock Trace
- 507 Flat Rock Trace
- 12 Sandy Shoals Pass
- 12 Sandy Shoals Pass
- 513 Flat Rock Trace
- 513 Flat Rock Trace
- 505 Flat Rock Trace