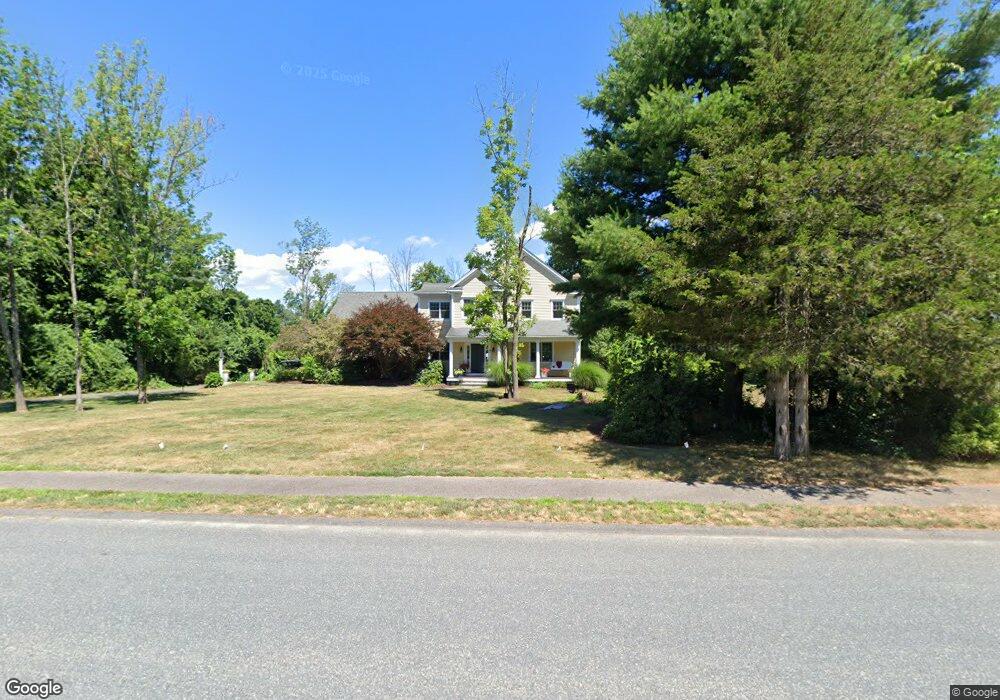
6 Sassamon Rd Natick, MA 01760
Estimated Value: $1,465,000 - $1,625,000
4
Beds
3
Baths
2,964
Sq Ft
$523/Sq Ft
Est. Value
About This Home
This home is located at 6 Sassamon Rd, Natick, MA 01760 and is currently estimated at $1,550,722, approximately $523 per square foot. 6 Sassamon Rd is a home located in Middlesex County with nearby schools including Natick High School, Memorial Elementary School, and J F Kennedy Middle School.
Ownership History
Date
Name
Owned For
Owner Type
Purchase Details
Closed on
Jun 3, 2004
Sold by
Cummings Erin G and Cummings Richard M
Bought by
Tullie Kathleen and Tullie Richard J
Current Estimated Value
Home Financials for this Owner
Home Financials are based on the most recent Mortgage that was taken out on this home.
Original Mortgage
$631,296
Outstanding Balance
$307,359
Interest Rate
5.94%
Mortgage Type
Purchase Money Mortgage
Estimated Equity
$1,243,363
Purchase Details
Closed on
Feb 23, 2001
Sold by
Joan H Brack T
Bought by
Cummings Richard M and Cummings Erin G
Create a Home Valuation Report for This Property
The Home Valuation Report is an in-depth analysis detailing your home's value as well as a comparison with similar homes in the area
Home Values in the Area
Average Home Value in this Area
Purchase History
| Date | Buyer | Sale Price | Title Company |
|---|---|---|---|
| Tullie Kathleen | $323,800 | -- | |
| Cummings Richard M | $250,000 | -- |
Source: Public Records
Mortgage History
| Date | Status | Borrower | Loan Amount |
|---|---|---|---|
| Open | Tullie Kathleen | $631,296 |
Source: Public Records
Tax History Compared to Growth
Tax History
| Year | Tax Paid | Tax Assessment Tax Assessment Total Assessment is a certain percentage of the fair market value that is determined by local assessors to be the total taxable value of land and additions on the property. | Land | Improvement |
|---|---|---|---|---|
| 2025 | $16,024 | $1,339,800 | $546,600 | $793,200 |
| 2024 | $15,557 | $1,268,900 | $517,700 | $751,200 |
| 2023 | $14,264 | $1,128,500 | $476,900 | $651,600 |
| 2022 | $13,812 | $1,035,400 | $425,700 | $609,700 |
| 2021 | $13,270 | $975,000 | $403,300 | $571,700 |
| 2020 | $13,041 | $958,200 | $386,500 | $571,700 |
| 2019 | $12,179 | $958,200 | $386,500 | $571,700 |
| 2018 | $11,372 | $871,400 | $369,700 | $501,700 |
| 2017 | $11,619 | $861,300 | $368,900 | $492,400 |
| 2016 | $11,627 | $856,800 | $368,900 | $487,900 |
| 2015 | $11,207 | $810,900 | $368,900 | $442,000 |
Source: Public Records
Map
Nearby Homes