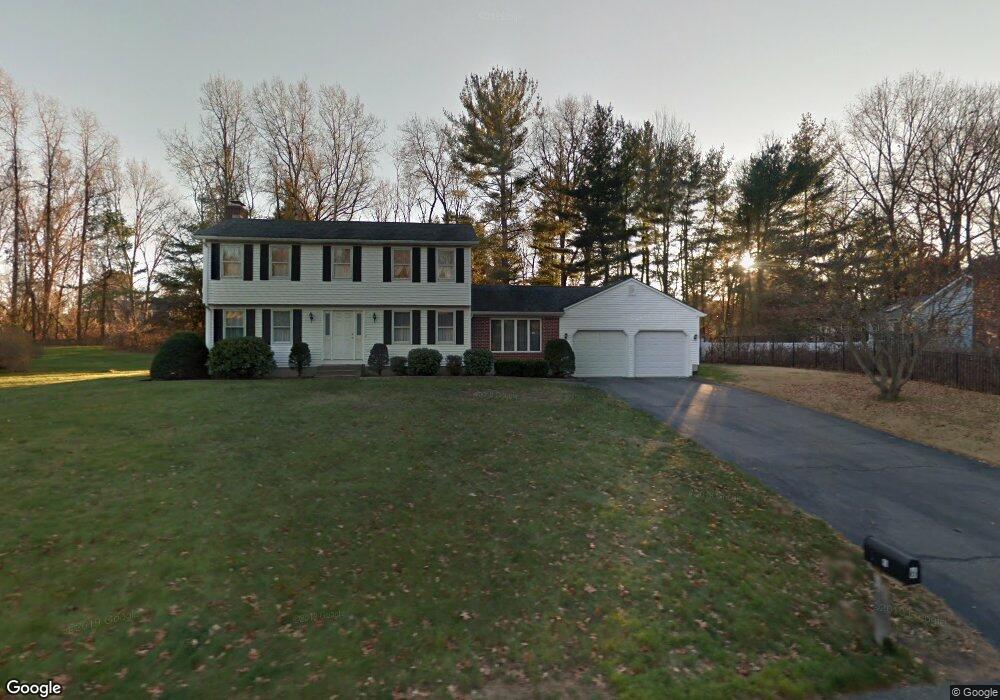
6 Silver Ln Easthampton, MA 01027
Estimated Value: $503,145 - $586,000
4
Beds
2
Baths
2,204
Sq Ft
$250/Sq Ft
Est. Value
About This Home
This home is located at 6 Silver Ln, Easthampton, MA 01027 and is currently estimated at $551,036, approximately $250 per square foot. 6 Silver Ln is a home located in Hampshire County with nearby schools including Easthampton High School, Calvary Baptist Christian School, and Tri-County Schools.
Ownership History
Date
Name
Owned For
Owner Type
Purchase Details
Closed on
Dec 1, 2011
Sold by
Kulisz Michael G
Bought by
Obrien Gaelan E
Current Estimated Value
Home Financials for this Owner
Home Financials are based on the most recent Mortgage that was taken out on this home.
Original Mortgage
$198,500
Outstanding Balance
$136,373
Interest Rate
4.1%
Mortgage Type
Purchase Money Mortgage
Estimated Equity
$414,663
Create a Home Valuation Report for This Property
The Home Valuation Report is an in-depth analysis detailing your home's value as well as a comparison with similar homes in the area
Home Values in the Area
Average Home Value in this Area
Purchase History
| Date | Buyer | Sale Price | Title Company |
|---|---|---|---|
| Obrien Gaelan E | $265,000 | -- |
Source: Public Records
Mortgage History
| Date | Status | Borrower | Loan Amount |
|---|---|---|---|
| Open | Obrien Gaelan E | $198,500 |
Source: Public Records
Tax History
| Year | Tax Paid | Tax Assessment Tax Assessment Total Assessment is a certain percentage of the fair market value that is determined by local assessors to be the total taxable value of land and additions on the property. | Land | Improvement |
|---|---|---|---|---|
| 2025 | $5,877 | $429,900 | $128,200 | $301,700 |
| 2024 | $5,739 | $423,200 | $124,400 | $298,800 |
| 2023 | $4,314 | $294,500 | $98,000 | $196,500 |
| 2022 | $4,868 | $294,500 | $98,000 | $196,500 |
| 2021 | $5,351 | $305,100 | $98,000 | $207,100 |
| 2020 | $5,230 | $294,500 | $98,000 | $196,500 |
| 2019 | $4,486 | $290,200 | $98,000 | $192,200 |
| 2018 | $4,315 | $269,700 | $92,400 | $177,300 |
| 2017 | $4,203 | $259,300 | $88,400 | $170,900 |
| 2016 | $4,042 | $259,300 | $88,400 | $170,900 |
| 2015 | $3,928 | $259,300 | $88,400 | $170,900 |
Source: Public Records
Map
Nearby Homes
Your Personal Tour Guide
Ask me questions while you tour the home.