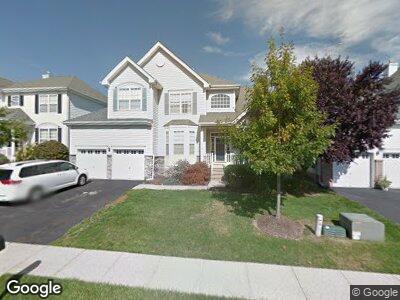
6 Stable Ln Flemington, NJ 08822
Estimated Value: $707,000 - $774,000
--
Bed
--
Bath
2,627
Sq Ft
$280/Sq Ft
Est. Value
About This Home
This home is located at 6 Stable Ln, Flemington, NJ 08822 and is currently estimated at $736,212, approximately $280 per square foot. 6 Stable Ln is a home located in Hunterdon County with nearby schools including Robert Hunter Elementary School, Reading Fleming Intermediate School, and J.P. Case Middle School.
Ownership History
Date
Name
Owned For
Owner Type
Purchase Details
Closed on
Jul 24, 2008
Sold by
Smith Nathaniel R and Smith Nancy
Bought by
Chen Quan
Current Estimated Value
Home Financials for this Owner
Home Financials are based on the most recent Mortgage that was taken out on this home.
Original Mortgage
$344,250
Interest Rate
6.47%
Mortgage Type
Purchase Money Mortgage
Purchase Details
Closed on
Jul 30, 2003
Bought by
Smith Nathaniel R and Paliotta Nancy M
Create a Home Valuation Report for This Property
The Home Valuation Report is an in-depth analysis detailing your home's value as well as a comparison with similar homes in the area
Home Values in the Area
Average Home Value in this Area
Purchase History
| Date | Buyer | Sale Price | Title Company |
|---|---|---|---|
| Chen Quan | $477,500 | Commonwealth | |
| Smith Nathaniel R | $440,340 | -- |
Source: Public Records
Mortgage History
| Date | Status | Borrower | Loan Amount |
|---|---|---|---|
| Open | Chen Quan | $311,100 | |
| Closed | Chen Quan | $344,250 |
Source: Public Records
Tax History Compared to Growth
Tax History
| Year | Tax Paid | Tax Assessment Tax Assessment Total Assessment is a certain percentage of the fair market value that is determined by local assessors to be the total taxable value of land and additions on the property. | Land | Improvement |
|---|---|---|---|---|
| 2024 | $11,754 | $431,500 | $198,300 | $233,200 |
| 2023 | $11,754 | $431,500 | $198,300 | $233,200 |
| 2022 | $11,456 | $431,500 | $198,300 | $233,200 |
| 2021 | $11,318 | $431,500 | $198,300 | $233,200 |
| 2020 | $11,094 | $431,500 | $198,300 | $233,200 |
| 2019 | $10,869 | $431,500 | $198,300 | $233,200 |
| 2018 | $10,736 | $431,500 | $198,300 | $233,200 |
| 2017 | $10,572 | $431,500 | $198,300 | $233,200 |
| 2016 | $10,382 | $431,500 | $198,300 | $233,200 |
| 2015 | $10,119 | $431,500 | $198,300 | $233,200 |
| 2014 | $9,985 | $431,500 | $198,300 | $233,200 |
Source: Public Records
Map
Nearby Homes