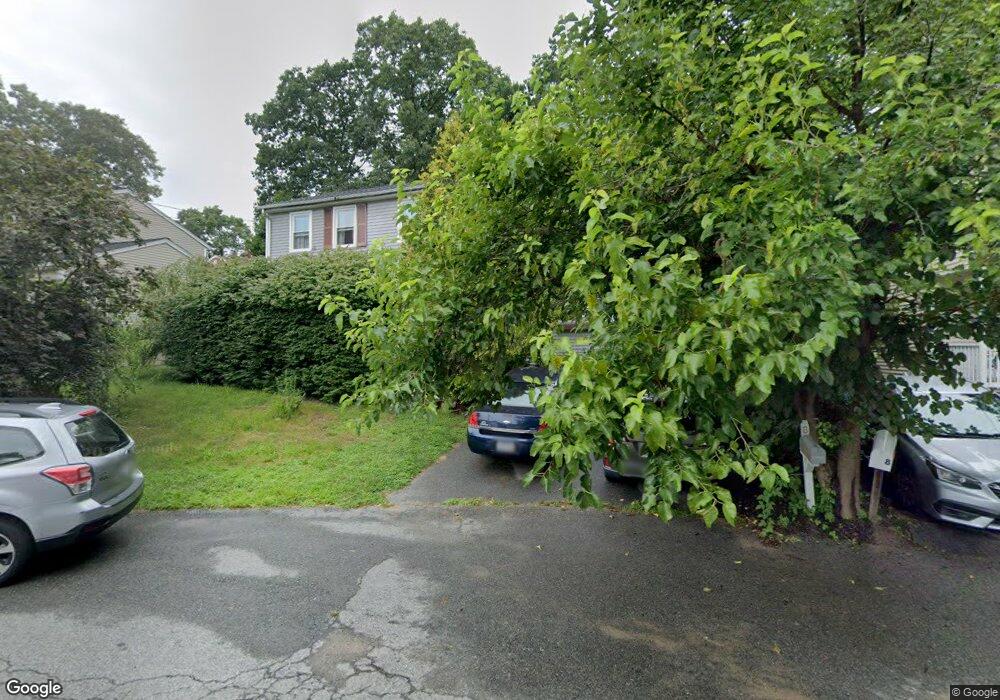
6 Sugar Pine Dr Cumberland, RI 02864
Cumberland Hill NeighborhoodEstimated Value: $527,863 - $588,000
3
Beds
2
Baths
1,788
Sq Ft
$316/Sq Ft
Est. Value
About This Home
This home is located at 6 Sugar Pine Dr, Cumberland, RI 02864 and is currently estimated at $564,966, approximately $315 per square foot. 6 Sugar Pine Dr is a home located in Providence County with nearby schools including John J. McLaughlin Cumberland Hill School, North Cumberland Middle School, and Cumberland High School.
Ownership History
Date
Name
Owned For
Owner Type
Purchase Details
Closed on
May 20, 2005
Sold by
Forand Laurie A
Bought by
Vitkin Aleksandr and Vitkin Eugenia
Current Estimated Value
Home Financials for this Owner
Home Financials are based on the most recent Mortgage that was taken out on this home.
Original Mortgage
$258,400
Interest Rate
5.95%
Mortgage Type
Purchase Money Mortgage
Purchase Details
Closed on
Sep 30, 2003
Sold by
Riel Denis J and Riel Lori Ann
Bought by
Forland Laurie A
Purchase Details
Closed on
Sep 4, 1998
Sold by
Diamond Homes Inc
Bought by
Riel Denis J and Riel Lori Ann
Create a Home Valuation Report for This Property
The Home Valuation Report is an in-depth analysis detailing your home's value as well as a comparison with similar homes in the area
Home Values in the Area
Average Home Value in this Area
Purchase History
| Date | Buyer | Sale Price | Title Company |
|---|---|---|---|
| Vitkin Aleksandr | $323,000 | -- | |
| Forland Laurie A | $278,000 | -- | |
| Riel Denis J | $134,000 | -- |
Source: Public Records
Mortgage History
| Date | Status | Borrower | Loan Amount |
|---|---|---|---|
| Closed | Riel Denis J | $141,900 | |
| Closed | Riel Denis J | $171,500 | |
| Closed | Riel Denis J | $258,400 |
Source: Public Records
Tax History
| Year | Tax Paid | Tax Assessment Tax Assessment Total Assessment is a certain percentage of the fair market value that is determined by local assessors to be the total taxable value of land and additions on the property. | Land | Improvement |
|---|---|---|---|---|
| 2025 | $4,984 | $406,200 | $133,900 | $272,300 |
| 2024 | $4,854 | $406,200 | $133,900 | $272,300 |
| 2023 | $4,720 | $406,200 | $133,900 | $272,300 |
| 2022 | $4,467 | $298,000 | $93,600 | $204,400 |
| 2021 | $4,393 | $298,000 | $93,600 | $204,400 |
| 2020 | $4,267 | $298,000 | $93,600 | $204,400 |
| 2019 | $4,186 | $263,600 | $78,200 | $185,400 |
| 2018 | $4,065 | $263,600 | $78,200 | $185,400 |
| 2017 | $4,009 | $263,600 | $78,200 | $185,400 |
| 2016 | $4,372 | $256,000 | $70,000 | $186,000 |
| 2015 | $4,372 | $256,000 | $70,000 | $186,000 |
| 2014 | $4,372 | $256,000 | $70,000 | $186,000 |
| 2013 | $4,120 | $261,100 | $73,800 | $187,300 |
Source: Public Records
Map
Nearby Homes
- 3 Quail St
- 3889 Mendon Rd
- 45 Valley View Dr
- 49 Poisson St
- 5 Edgewood Ave
- 42 Armand Ave
- 19 Marques St
- 86 Branch Ave
- 229 Louise St
- 39 Louise St
- 4 Plant St
- 31 Stoney View Dr
- 252 Railroad St
- 200 Manville Hill Rd Unit 64
- 250 Ray Ave
- 375 Congress St
- 253 Central St
- 1 Bouvier Ave
- 237 Congress St
- 200 Heroux Blvd Unit 406