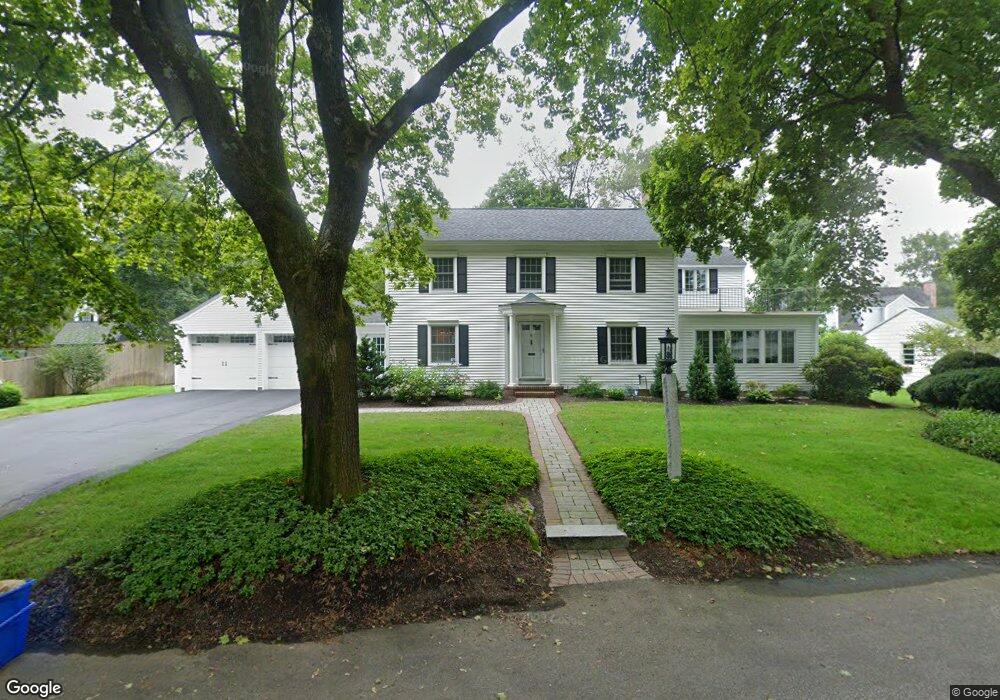
6 Sunset Ave Concord, NH 03301
South End NeighborhoodEstimated Value: $636,000 - $681,000
3
Beds
3
Baths
2,382
Sq Ft
$279/Sq Ft
Est. Value
About This Home
This home is located at 6 Sunset Ave, Concord, NH 03301 and is currently estimated at $664,320, approximately $278 per square foot. 6 Sunset Ave is a home located in Merrimack County with nearby schools including Abbot-Downing School, Rundlett Middle School, and Concord High School.
Ownership History
Date
Name
Owned For
Owner Type
Purchase Details
Closed on
Mar 24, 2023
Sold by
Segal Elizabeth F
Bought by
Elizabeth F Segal T
Current Estimated Value
Purchase Details
Closed on
Apr 2, 2004
Sold by
Marion L Berman T
Bought by
Segal Robert M and Segal Elizabeth F
Home Financials for this Owner
Home Financials are based on the most recent Mortgage that was taken out on this home.
Original Mortgage
$185,000
Interest Rate
5.56%
Mortgage Type
Purchase Money Mortgage
Create a Home Valuation Report for This Property
The Home Valuation Report is an in-depth analysis detailing your home's value as well as a comparison with similar homes in the area
Home Values in the Area
Average Home Value in this Area
Purchase History
| Date | Buyer | Sale Price | Title Company |
|---|---|---|---|
| Elizabeth F Segal T | -- | None Available | |
| Segal Elizabeth F | -- | None Available | |
| Segal Robert M | $350,000 | -- |
Source: Public Records
Mortgage History
| Date | Status | Borrower | Loan Amount |
|---|---|---|---|
| Previous Owner | Segal Robert M | $206,000 | |
| Previous Owner | Segal Robert M | $215,000 | |
| Previous Owner | Segal Robert M | $75,000 | |
| Previous Owner | Segal Robert M | $185,000 |
Source: Public Records
Tax History
| Year | Tax Paid | Tax Assessment Tax Assessment Total Assessment is a certain percentage of the fair market value that is determined by local assessors to be the total taxable value of land and additions on the property. | Land | Improvement |
|---|---|---|---|---|
| 2025 | $13,009 | $446,900 | $120,300 | $326,600 |
| 2024 | $12,330 | $445,300 | $120,300 | $325,000 |
| 2023 | $11,961 | $445,300 | $120,300 | $325,000 |
| 2022 | $11,529 | $445,300 | $120,300 | $325,000 |
| 2021 | $11,186 | $445,300 | $120,300 | $325,000 |
| 2020 | $11,081 | $414,100 | $94,400 | $319,700 |
| 2019 | $10,423 | $375,200 | $98,100 | $277,100 |
| 2018 | $10,103 | $358,400 | $98,400 | $260,000 |
| 2017 | $9,892 | $350,300 | $98,400 | $251,900 |
| 2016 | $9,388 | $339,300 | $96,600 | $242,700 |
| 2015 | $8,782 | $316,500 | $104,800 | $211,700 |
| 2014 | $8,485 | $316,500 | $104,800 | $211,700 |
| 2013 | -- | $316,500 | $104,800 | $211,700 |
| 2012 | -- | $315,900 | $110,400 | $205,500 |
Source: Public Records
Map
Nearby Homes
- 0 South St Unit 4969509
- 33 Joffre St
- 40 Nivelle St
- 335 S Main St
- 289 South St
- 47 Noyes St
- 273-279 S Main St
- 47 South St
- 30 Longmeadow Dr
- 58 S State St
- 111 -113 South Main St
- 7-9 Myrtle St
- 25 N Spring St
- 5 Holly Cir
- 5 Windchime Dr
- 21 Fairfield Dr
- 22 Fairfield Dr
- 20 Fairfield Dr
- 4 Bow Center Rd Unit F2
- 26 Jonathan Ln
Your Personal Tour Guide
Ask me questions while you tour the home.