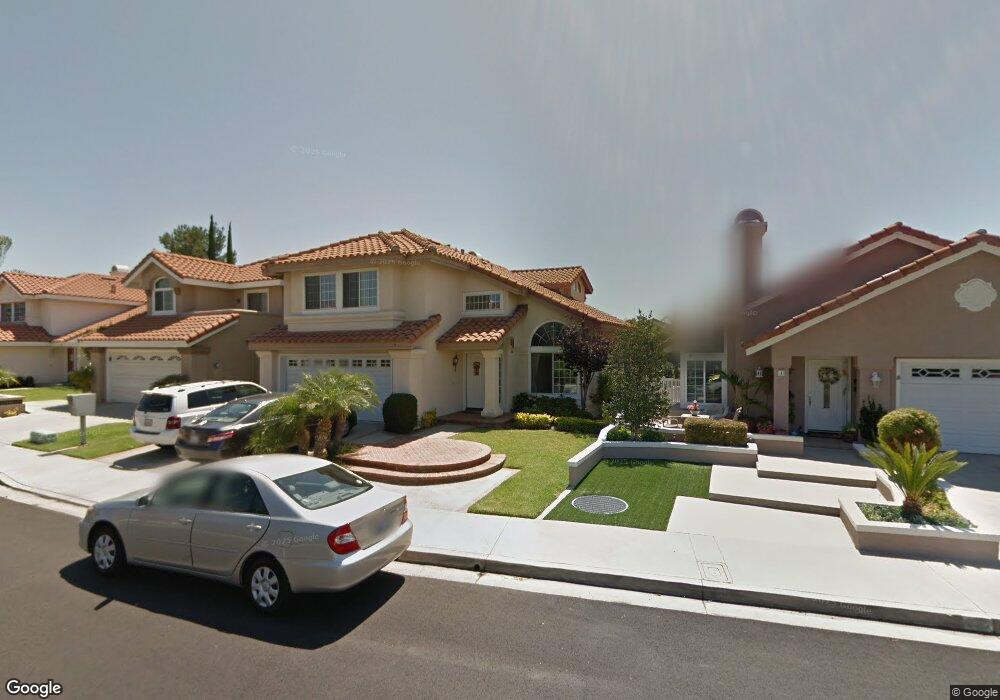
6 Tepolito Rancho Santa Margarita, CA 92688
Estimated Value: $1,184,415 - $1,277,000
4
Beds
3
Baths
1,977
Sq Ft
$626/Sq Ft
Est. Value
About This Home
This home is located at 6 Tepolito, Rancho Santa Margarita, CA 92688 and is currently estimated at $1,238,354, approximately $626 per square foot. 6 Tepolito is a home located in Orange County with nearby schools including Trabuco Mesa Elementary School, Rancho Santa Margarita Intermediate School, and Trabuco Hills High School.
Ownership History
Date
Name
Owned For
Owner Type
Purchase Details
Closed on
May 17, 2013
Sold by
Garro Robert P and Garro Virginia E
Bought by
Garro Robert P and Garro Virginia E
Current Estimated Value
Home Financials for this Owner
Home Financials are based on the most recent Mortgage that was taken out on this home.
Original Mortgage
$417,000
Outstanding Balance
$294,559
Interest Rate
3.41%
Mortgage Type
New Conventional
Estimated Equity
$943,796
Purchase Details
Closed on
Apr 12, 2002
Sold by
Clark June F and Morrison Julie M
Bought by
Garro Robert and Garro Virginia
Home Financials for this Owner
Home Financials are based on the most recent Mortgage that was taken out on this home.
Original Mortgage
$284,900
Interest Rate
7.18%
Purchase Details
Closed on
Sep 12, 1996
Sold by
Morrison Julie M and Morrison June F
Bought by
Clark June F and Morrison Julie M
Create a Home Valuation Report for This Property
The Home Valuation Report is an in-depth analysis detailing your home's value as well as a comparison with similar homes in the area
Home Values in the Area
Average Home Value in this Area
Purchase History
| Date | Buyer | Sale Price | Title Company |
|---|---|---|---|
| Garro Robert P | -- | First American Title Company | |
| Garro Robert | $375,000 | Commerce Title | |
| Clark June F | -- | Orange Coast Title |
Source: Public Records
Mortgage History
| Date | Status | Borrower | Loan Amount |
|---|---|---|---|
| Open | Garro Robert P | $417,000 | |
| Closed | Garro Robert | $284,900 |
Source: Public Records
Tax History Compared to Growth
Tax History
| Year | Tax Paid | Tax Assessment Tax Assessment Total Assessment is a certain percentage of the fair market value that is determined by local assessors to be the total taxable value of land and additions on the property. | Land | Improvement |
|---|---|---|---|---|
| 2025 | $5,595 | $553,978 | $305,542 | $248,436 |
| 2024 | $5,595 | $543,116 | $299,551 | $243,565 |
| 2023 | $5,466 | $532,467 | $293,677 | $238,790 |
| 2022 | $5,371 | $522,027 | $287,919 | $234,108 |
| 2021 | $4,367 | $511,792 | $282,274 | $229,518 |
| 2020 | $5,226 | $506,545 | $279,380 | $227,165 |
| 2019 | $5,685 | $496,613 | $273,902 | $222,711 |
| 2018 | $5,597 | $486,876 | $268,531 | $218,345 |
| 2017 | $5,634 | $477,330 | $263,266 | $214,064 |
| 2016 | $6,179 | $467,971 | $258,104 | $209,867 |
| 2015 | $6,354 | $460,942 | $254,227 | $206,715 |
| 2014 | $6,239 | $451,913 | $249,247 | $202,666 |
Source: Public Records
Map
Nearby Homes
- 4 Raposa
- 1 El Canto
- 4 Pica Flor Unit 54
- 31 Gaviota Unit 136
- 16 Las Piedras
- 73 Gaviota
- 54 Gavilan
- 70 Gavilan Unit 18
- 25 Dewberry
- 12 Paseo Vecino
- 15 Temecula Ct
- 12 Paseo Fucsia
- 29 Via Pamplona Unit 78
- 20 Via Meseta
- 7 Via Cresta Unit 117
- 9 Via Cresta
- 87 Calle de Felicidad
- 21 Silktassel
- 71 Via Cresta
- 45 Via Prado