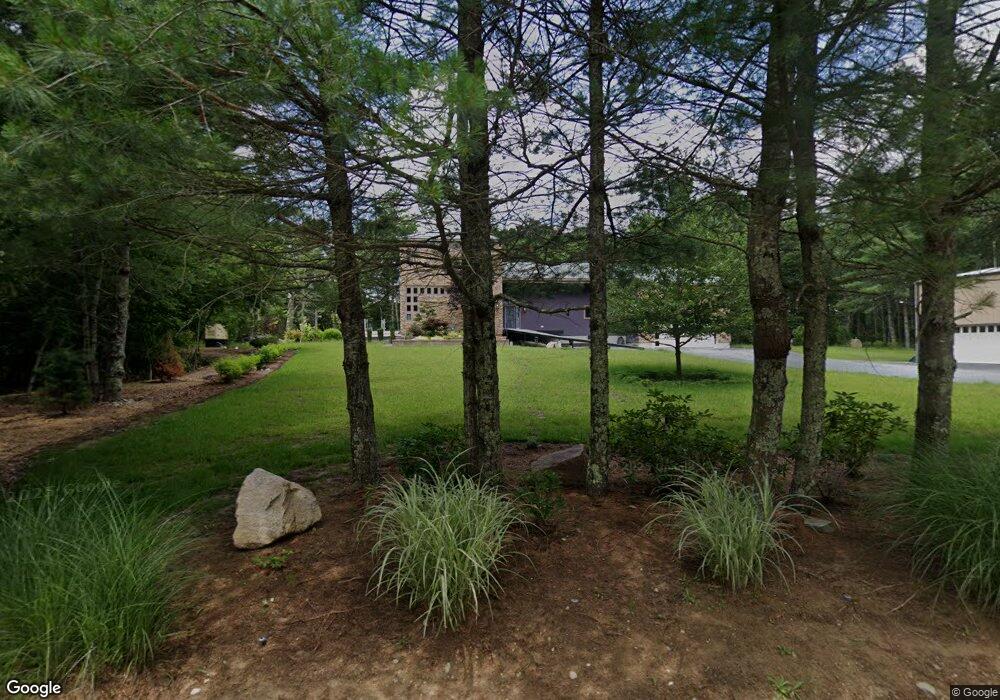
6 Trinity Ln Lakeville, MA 02347
Estimated Value: $664,000 - $868,581
3
Beds
2
Baths
1,142
Sq Ft
$700/Sq Ft
Est. Value
About This Home
This home is located at 6 Trinity Ln, Lakeville, MA 02347 and is currently estimated at $798,895, approximately $699 per square foot. 6 Trinity Ln is a home located in Plymouth County with nearby schools including George R Austin Intermediate School, Assawompset Elementary School, and Freetown-Lakeville Middle School.
Ownership History
Date
Name
Owned For
Owner Type
Purchase Details
Closed on
Dec 6, 2010
Sold by
Marangi David J
Bought by
Kinan Joseph
Current Estimated Value
Home Financials for this Owner
Home Financials are based on the most recent Mortgage that was taken out on this home.
Original Mortgage
$219,198
Outstanding Balance
$145,041
Interest Rate
4.25%
Mortgage Type
FHA
Estimated Equity
$653,854
Purchase Details
Closed on
Nov 23, 2009
Sold by
Marangi David J
Bought by
Trinity Lane Rt and Medeiros Edward J
Purchase Details
Closed on
Jan 7, 2009
Sold by
Marangi David J
Bought by
Marangi David J
Home Financials for this Owner
Home Financials are based on the most recent Mortgage that was taken out on this home.
Original Mortgage
$194,000
Interest Rate
5.99%
Mortgage Type
Purchase Money Mortgage
Purchase Details
Closed on
Aug 8, 2006
Sold by
Davis Neil G
Bought by
Marangi David J
Create a Home Valuation Report for This Property
The Home Valuation Report is an in-depth analysis detailing your home's value as well as a comparison with similar homes in the area
Home Values in the Area
Average Home Value in this Area
Purchase History
| Date | Buyer | Sale Price | Title Company |
|---|---|---|---|
| Kinan Joseph | $224,900 | -- | |
| Trinity Lane Rt | $120,000 | -- | |
| Marangi David J | -- | -- | |
| Marangi David J | $230,000 | -- |
Source: Public Records
Mortgage History
| Date | Status | Borrower | Loan Amount |
|---|---|---|---|
| Open | Kinan Joseph | $219,198 | |
| Previous Owner | Marangi David J | $194,000 | |
| Previous Owner | Marangi David J | $50,000 |
Source: Public Records
Tax History Compared to Growth
Tax History
| Year | Tax Paid | Tax Assessment Tax Assessment Total Assessment is a certain percentage of the fair market value that is determined by local assessors to be the total taxable value of land and additions on the property. | Land | Improvement |
|---|---|---|---|---|
| 2025 | $8,721 | $842,600 | $181,200 | $661,400 |
| 2024 | $8,745 | $828,900 | $177,500 | $651,400 |
| 2023 | $8,186 | $734,200 | $169,200 | $565,000 |
| 2022 | $8,048 | $666,800 | $159,300 | $507,500 |
| 2021 | $3,465 | $613,100 | $142,200 | $470,900 |
| 2020 | $7,694 | $589,100 | $138,200 | $450,900 |
| 2019 | $3,214 | $560,500 | $132,800 | $427,700 |
| 2018 | $4,243 | $312,200 | $124,300 | $187,900 |
| 2017 | $4,129 | $297,900 | $140,500 | $157,400 |
| 2016 | $4,027 | $285,000 | $133,800 | $151,200 |
| 2015 | $4,093 | $287,200 | $138,100 | $149,100 |
Source: Public Records
Map
Nearby Homes
- 36 Mill St
- 7 Great Cedar Crossing
- 95 Howland Rd
- 1 Elaine Cir
- Lot 2 Sherwood Ln
- Lot 1 Sherwood Ln
- 20 Grove St
- 6 Weetamoe Dr
- 57 County St
- 15 Leonard Ave
- 90 Howland Rd
- 15 Slab Bridge Rd
- 24 Bells Brook Rd
- 20 Slab Bridge Rd
- 10 Dean St
- 10 Mill St
- 195 Slab Bridge Rd
- 5 Nottingham Way
- 1 Elm St
- 15-RR Algerine St