6 University Ct Buffalo Grove, IL 60089
South Buffalo Grove NeighborhoodEstimated Value: $419,068 - $464,000
3
Beds
3
Baths
1,350
Sq Ft
$328/Sq Ft
Est. Value
About This Home
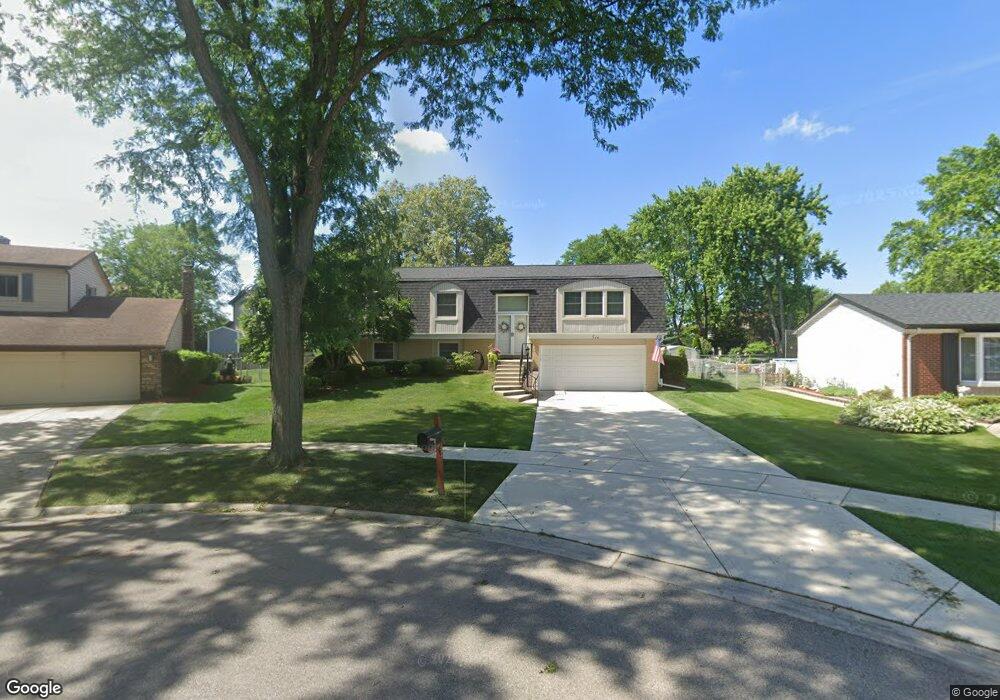
This home is located at 6 University Ct, Buffalo Grove, IL 60089 and is currently estimated at $442,267, approximately $327 per square foot. 6 University Ct is a home located in Cook County with nearby schools including Booth Tarkington Elementary School, Jack London Middle School, and Wheeling High School.
Ownership History
Date
Name
Owned For
Owner Type
Purchase Details
Closed on
Oct 5, 2017
Sold by
Olliges James A and Olliges Maria I
Bought by
Olliges James A and Olliges Maria I
Current Estimated Value
Purchase Details
Closed on
Nov 3, 2006
Sold by
Olliges James A and Olliges Maria I
Bought by
James A & Maria L Olliges Living Trust
Purchase Details
Closed on
May 27, 2002
Sold by
Braswell James and Braswell Michele
Bought by
Olliges James A and Olliges Maria I
Home Financials for this Owner
Home Financials are based on the most recent Mortgage that was taken out on this home.
Original Mortgage
$225,000
Outstanding Balance
$96,076
Interest Rate
6.95%
Estimated Equity
$346,191
Purchase Details
Closed on
Sep 30, 1999
Sold by
Goetz Siegfried and Goetz Anne
Bought by
Braswell James and Braswell Michele
Home Financials for this Owner
Home Financials are based on the most recent Mortgage that was taken out on this home.
Original Mortgage
$175,600
Interest Rate
7.93%
Create a Home Valuation Report for This Property
The Home Valuation Report is an in-depth analysis detailing your home's value as well as a comparison with similar homes in the area
Home Values in the Area
Average Home Value in this Area
Purchase History
| Date | Buyer | Sale Price | Title Company |
|---|---|---|---|
| Olliges James A | -- | Attorney | |
| James A & Maria L Olliges Living Trust | -- | None Available | |
| Olliges James A | $285,000 | Golden Title | |
| Braswell James | $219,500 | -- |
Source: Public Records
Mortgage History
| Date | Status | Borrower | Loan Amount |
|---|---|---|---|
| Open | Olliges James A | $225,000 | |
| Previous Owner | Braswell James | $175,600 | |
| Closed | Braswell James | $21,950 |
Source: Public Records
Tax History Compared to Growth
Tax History
| Year | Tax Paid | Tax Assessment Tax Assessment Total Assessment is a certain percentage of the fair market value that is determined by local assessors to be the total taxable value of land and additions on the property. | Land | Improvement |
|---|---|---|---|---|
| 2024 | $8,220 | $29,000 | $9,649 | $19,351 |
| 2023 | $7,876 | $29,000 | $9,649 | $19,351 |
| 2022 | $7,876 | $29,000 | $9,649 | $19,351 |
| 2021 | $8,388 | $27,071 | $6,164 | $20,907 |
| 2020 | $8,241 | $27,071 | $6,164 | $20,907 |
| 2019 | $8,241 | $30,046 | $6,164 | $23,882 |
| 2018 | $7,395 | $24,908 | $5,360 | $19,548 |
| 2017 | $7,279 | $24,908 | $5,360 | $19,548 |
| 2016 | $7,039 | $24,908 | $5,360 | $19,548 |
| 2015 | $7,261 | $23,996 | $4,556 | $19,440 |
| 2014 | $7,159 | $23,996 | $4,556 | $19,440 |
| 2013 | $7,027 | $25,381 | $4,556 | $20,825 |
Source: Public Records
Map
Nearby Homes
- 441 Commanche Trail Unit 3100
- 1485 Chippewa Trail
- 3026 Jackson Dr
- 528 Surf Ct
- 314 Anthony Rd
- 1637 Tahoe Circle Dr Unit 209
- 200 Lake Blvd Unit 439
- 175 Lake Blvd Unit 301
- 413 Buffalo Trail Unit 10601
- 671 Cedarwood Ct Unit 2
- 416 Trinity Ct
- 2822 Jackson Dr
- 691 Lakeside Circle Dr
- 2812 Jackson Dr
- 705 Lakeside Circle Dr Unit 2
- 150 Lake Blvd Unit 125
- 250 Lake Blvd Unit 218
- 52 Schoenbeck Rd
- 1088 Captains Ln
- 791 Lakeside Circle Dr Unit 1
- 5 University Ct
- 7 University Dr
- 434 Pacific Ct
- 432 Pacific Ct Unit 1
- 436 Pacific Ct
- 429 Pacific Ct
- 8 University Dr
- 431 Pacific Ct
- 433 Irvine Ct
- 438 Pacific Ct
- 9 University Ct
- 3 University Ct
- 435 Irvine Ct
- 431 Irvine Ct
- 433 Pacific Ct
- 442 Pacific Ct
- 11 University Dr
- 12 University Ct
- 9 Cambridge Ct
- 10 University Ct