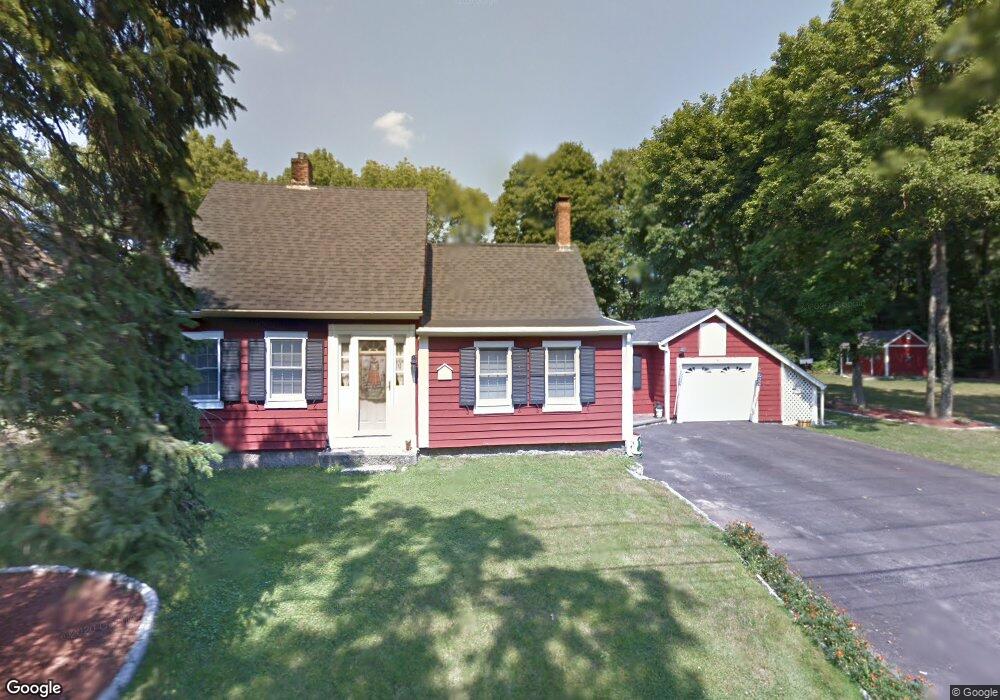
6 Walnut St Foxboro, MA 02035
Estimated Value: $575,684 - $695,000
3
Beds
2
Baths
1,411
Sq Ft
$461/Sq Ft
Est. Value
About This Home
This home is located at 6 Walnut St, Foxboro, MA 02035 and is currently estimated at $650,671, approximately $461 per square foot. 6 Walnut St is a home located in Norfolk County with nearby schools including Foxborough High School, Foxborough Regional Charter School, and Hands-On-Montessori School.
Ownership History
Date
Name
Owned For
Owner Type
Purchase Details
Closed on
Dec 12, 1990
Sold by
Greeley Michael J
Bought by
Engler Robert J
Current Estimated Value
Home Financials for this Owner
Home Financials are based on the most recent Mortgage that was taken out on this home.
Original Mortgage
$139,500
Interest Rate
10.07%
Mortgage Type
Purchase Money Mortgage
Create a Home Valuation Report for This Property
The Home Valuation Report is an in-depth analysis detailing your home's value as well as a comparison with similar homes in the area
Home Values in the Area
Average Home Value in this Area
Purchase History
| Date | Buyer | Sale Price | Title Company |
|---|---|---|---|
| Engler Robert J | $155,000 | -- |
Source: Public Records
Mortgage History
| Date | Status | Borrower | Loan Amount |
|---|---|---|---|
| Closed | Engler Robert J | $90,000 | |
| Closed | Engler Robert J | $131,250 | |
| Closed | Engler Robert J | $136,000 | |
| Closed | Engler Robert J | $139,500 |
Source: Public Records
Tax History Compared to Growth
Tax History
| Year | Tax Paid | Tax Assessment Tax Assessment Total Assessment is a certain percentage of the fair market value that is determined by local assessors to be the total taxable value of land and additions on the property. | Land | Improvement |
|---|---|---|---|---|
| 2025 | $6,077 | $459,700 | $225,300 | $234,400 |
| 2024 | $5,901 | $436,800 | $225,300 | $211,500 |
| 2023 | $5,717 | $402,300 | $214,500 | $187,800 |
| 2022 | $5,658 | $389,700 | $205,100 | $184,600 |
| 2021 | $5,467 | $370,900 | $186,500 | $184,400 |
| 2020 | $5,404 | $370,900 | $186,500 | $184,400 |
| 2019 | $5,204 | $354,000 | $177,600 | $176,400 |
| 2018 | $4,879 | $334,900 | $177,600 | $157,300 |
| 2017 | $4,574 | $304,100 | $166,000 | $138,100 |
| 2016 | $4,467 | $301,400 | $159,800 | $141,600 |
| 2015 | $4,346 | $286,100 | $134,900 | $151,200 |
| 2014 | $3,989 | $266,100 | $132,300 | $133,800 |
Source: Public Records
Map
Nearby Homes
- 80 Mill St
- 12 Spring St
- 356 Central St
- 11 W Belcher Rd Unit 2
- 406 South St
- 14 Baker St
- 24 Mechanic St
- 11 Orchard Place Unit 11
- 84 Cocasset St Unit A6
- 18 Winter St Unit E
- 14 Winter St Unit B
- 450 West St
- 166 Chauncy St
- 14 Foxhill Rd
- 619 N Main St
- 28 Angell St
- 42 Angell St
- 44 Angell St Unit 44
- 11 Goodwin Dr
- 483 Thurston St